Parts of the United States already appear to be the middle of a dangerous new surge in severe COVID-19 cases.
Whatever the omicron variant of the virus that’s causing the pandemic does, the delta variant and other more established variants are making your clients sick now.
The government’s latest pandemic Community Profile Report shows that the number of new cases recorded in the seven-day period ending Wednesday has increased to 829,608, up 37% from the total the week before. In other words, roughly 1 in every 400 Americans tested positive for a new case of COVID-19 last week.
The number of deaths increased to 7,829, from 5,979 the week before, and the death rate increased to 2.4 per 100,000 people, from 1.8 per 100,000 people.
One sign that mortality rates, and the number of claims flowing into life insurers and life reinsurers, could remain elevated is that reports are emerging of physicians in many states struggling to find hospital intensive care unit beds for any patients, including COVID-19 patients, who need ICU-level care.
When the pandemic fills ICU beds, that means that COVID-19 could drive up the death rate from causes such as strokes, cancer, heart attacks and accidents, by keeping people with those conditions from getting suitable care.
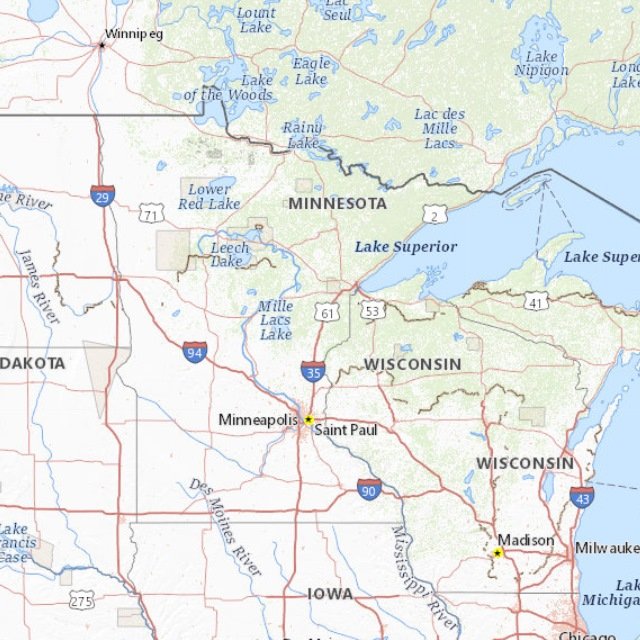
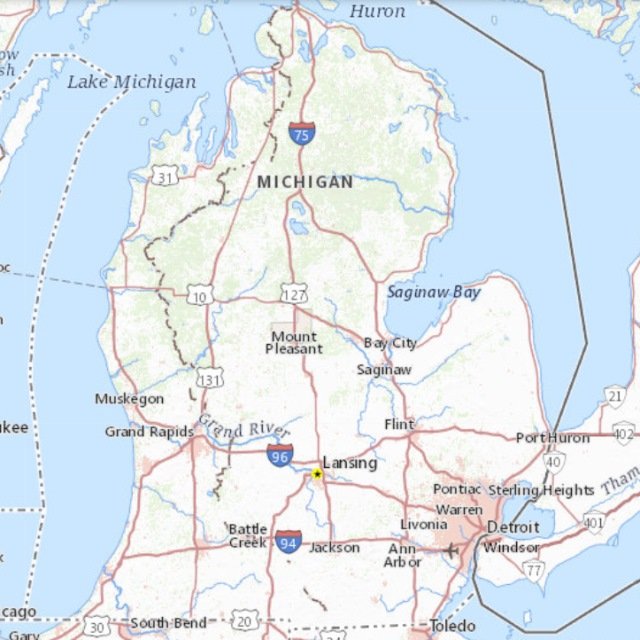
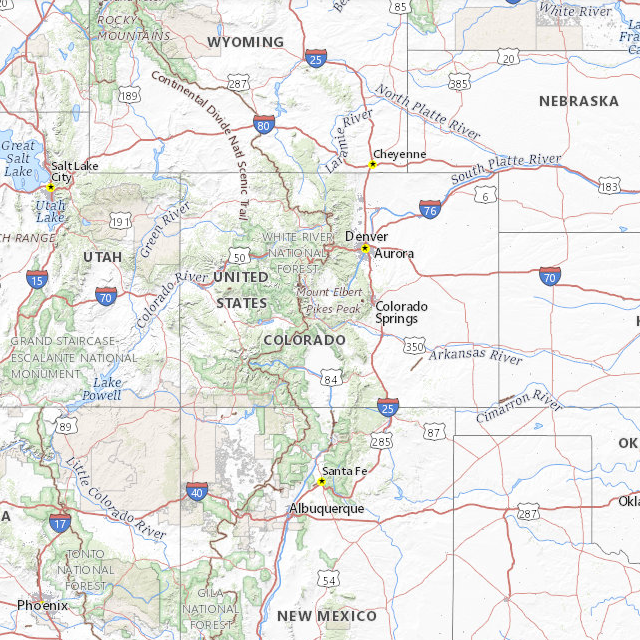
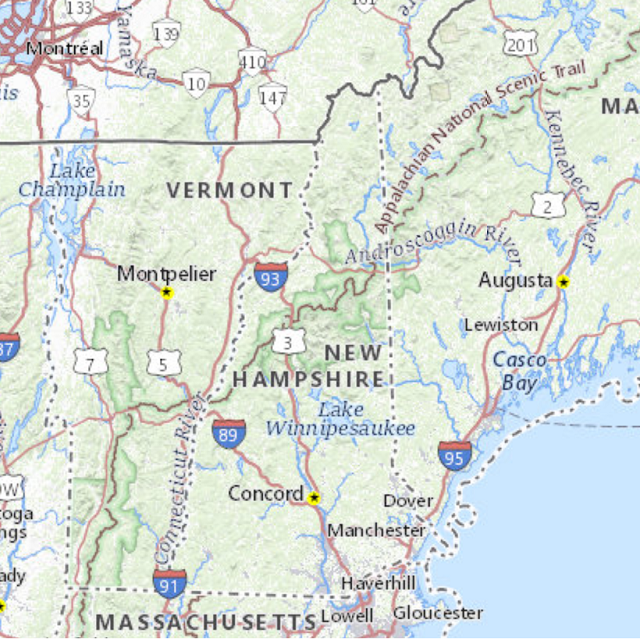
For a look at the five states with the worst COVID-19 adult ICU bed occupancy percentages, based on HHS hospital pandemic impact data, as of Dec. 1, see the slideshow above.
For COVID-19 ICU bed occupancy rates for all 50 states and the District of Columbia, for the first Wednesday of the month in November 2020, February 2021 and this month, see the chart below.
ICU Capacity
The United States has about 6,100 hospitals with ICU units.
The pandemic has exacerbated existing nursing shortages in many areas, and a lack of the kinds of nurses who can care for COVID-19 patients has forced hospitals to keep some of their ICU beds empty.
Physicians and nurses have reported seeing some hospitals in hard-hit areas leaving 20% or more of their ICU beds empty due to staffing problems.
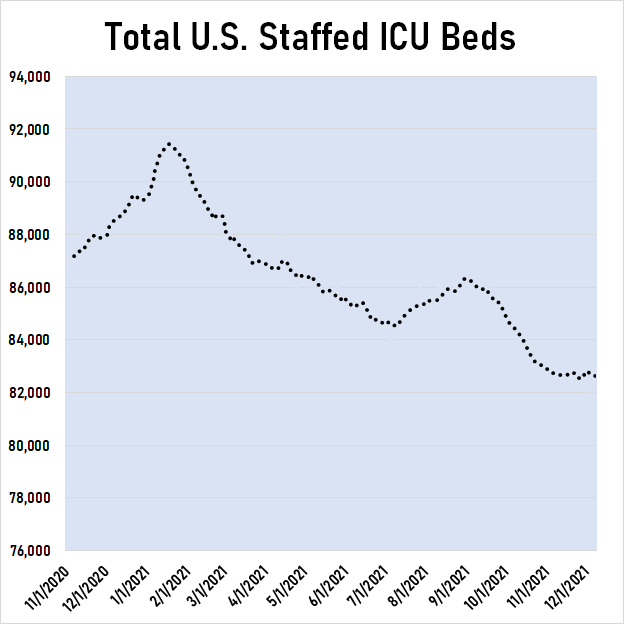
Pandemic impact statistics compiled by a U.S. Department of Health and Human Services team show that the number of hospital ICU beds included in the HHS peaked at around 91,000, in mid-January 2021, and has now fallen about 8% from that peak, to less than 84,000.
Patients With Confirmed and Suspected COVID-19 in ICU Beds
| Nov. 4, 2020 | Feb. 3, 2021 | Dec. 1, 2021 | ||||
|---|---|---|---|---|---|---|
| Number | % of Adult Staffed Beds Filled | Number | % of Adult Staffed Beds Filled | Number | % of Adult Staffed Beds Filled | |
| Alabama | 321 | 20.9% | 603 | 36.6% | 133 | 8.5% |
| Alaska | 25 | 19.8% | 14 | 11.2% | 22 | 17.6% |
| Arizona | 275 | 13.8% | 844 | 35.7% | 594 | 27.0% |
| Arkansas | 229 | 21.2% | 234 | 22.2% | 166 | 17.5% |
| California | 907 | 12.1% | 3,711 | 43.5% | 907 | 12.8% |
| Colorado | 302 | 22.9% | 165 | 12.2% | 508 | 38.5% |
| Connecticut | 82 | 7.6% | 184 | 17.1% | 87 | 8.5% |
| Delaware | 30 | 16.9% | 37 | 19.1% | 29 | 14.9% |
| District of Columbia | 40 | 10.2% | 67 | 19.1% | 25 | 7.4% |
| Florida | 683 | 10.6% | 1,347 | 20.8% | 262 | 4.1% |
| Georgia | 486 | 17.7% | 1,109 | 37.5% | 272 | 10.3% |
| Hawaii | 19 | 7.8% | 27 | 12.1% | 11 | 5.3% |
| Idaho | 80 | 25.8% | 43 | 14.2% | 92 | 31.5% |
| Illinois | 794 | 20.5% | 496 | 14.0% | 509 | 15.6% |
| Indiana | 498 | 22.6% | 359 | 16.2% | 635 | 27.3% |
| Iowa | 194 | 27.9% | 77 | 11.5% | 167 | 27.2% |
| Kansas | 175 | 21.6% | 116 | 13.7% | 160 | 19.5% |
| Kentucky | 251 | 15.9% | 329 | 17.9% | 262 | 18.3% |
| Louisiana | 200 | 10.5% | 344 | 18.3% | 80 | 5.3% |
| Maine | 17 | 5.1% | 58 | 16.9% | 105 | 30.1% |
| Maryland | 188 | 14.7% | 388 | 28.1% | 207 | 15.6% |
| Massachusetts | 141 | 7.2% | 348 | 23.3% | 206 | 15.8% |
| Michigan | 481 | 18.9% | 316 | 11.9% | 940 | 36.9% |
| Minnesota | 254 | 24.1% | 96 | 10.5% | 361 | 36.6% |
| Mississippi | 172 | 22.4% | 277 | 31.8% | 58 | 7.3% |
| Missouri | 509 | 22.5% | 410 | 22.1% | 396 | 21.4% |
| Montana | 82 | 41.8% | 23 | 10.5% | 67 | 29.4% |
| Nebraska | 183 | 29.2% | 85 | 15.0% | 151 | 30.8% |
| Nevada | 159 | 18.6% | 243 | 26.6% | 151 | 18.4% |
| New Hampshire | 18 | 6.4% | 50 | 17.7% | 90 | 39.1% |
| New Jersey | 226 | 10.2% | 524 | 17.8% | 199 | 6.8% |
| New Mexico | 160 | 39.2% | 142 | 29.7% | 202 | 42.9% |
| New York | 332 | 5.7% | 1,570 | 27.8% | 630 | 12.6% |
| North Carolina | 362 | 14.7% | 622 | 24.4% | 336 | 14.8% |
| North Dakota | 64 | 46.7% | 21 | 10.1% | 67 | 32.1% |
| Ohio | 543 | 13.9% | 651 | 15.6% | 1,008 | 25.6% |
| Oklahoma | 315 | 26.6% | 350 | 31.7% | 182 | 18.1% |
| Oregon | 63 | 8.0% | 77 | 9.6% | 93 | 11.8% |
| Pennsylvania | 496 | 13.1% | 745 | 19.1% | 875 | 23.1% |
| Puerto Rico | 60 | 8.8% | 54 | 7.7% | 4 | 0.6% |
| Rhode Island | 22 | 12.6% | 43 | 26.1% | 18 | 13.8% |
| South Carolina | 219 | 16.8% | 356 | 29.1% | 129 | 9.9% |
| South Dakota | 92 | 43.6% | 23 | 9.5% | 61 | 24.2% |
| Tennessee | 480 | 19.5% | 431 | 17.8% | 274 | 11.2% |
| Texas | 1,861 | 26.0% | 3,095 | 40.1% | 998 | 15.3% |
| Utah | 149 | 23.3% | 136 | 21.7% | 192 | 30.9% |
| Vermont | 6 | 9.0% | 12 | 11.3% | 23 | 24.5% |
| Virginia | 241 | 11.6% | 450 | 22.3% | 249 | 12.9% |
| Washington | 131 | 11.4% | 175 | 13.1% | 246 | 19.9% |
| West Virginia | 95 | 13.5% | 125 | 17.5% | 165 | 25.2% |
| Wisconsin | 396 | 24.8% | 186 | 11.5% | 417 | 27.1% |
| Wyoming | 33 | 26.0% | 9 | 6.3% | 21 | 15.1% |
| TOTAL | 14,141 | 22,197 | 14,042 | |||
| MEDIAN | 17.3% | 17.8% | 17.9% | |||
Pictured: An intubated patient inside a negative pressure room in the COVIID-19 ICU at Freeman Hospital West in Joplin, Mo., in August 2021. (Photo: Angus Mordant/Bloomberg)


 December 10, 2021 at 03:17 PM




 Slideshow


