A batch of 2021 drinking data from the U.S. Centers for Disease Control and Prevention shows why many clients may live longer than expected, in spite of the COVID-19 pandemic: They’re trying to take better care of themselves.
Only 6.3% of all U.S. adults reported drinking heavily in 2021. That’s down from 6.5% in 2019, before the pandemic began, and down from 6.5% in 2016.
For college-educated adults, the heavy-drinker rate fell even more: to 5.9%, from 6.25% in 2019, and from 6.5% in 2016.
At the state level, the college grad heavy-drinker rate change ranged from an increase of 1.9 percentage points, in New Hampshire, to a decrease of 2.8 percentage points in two states.
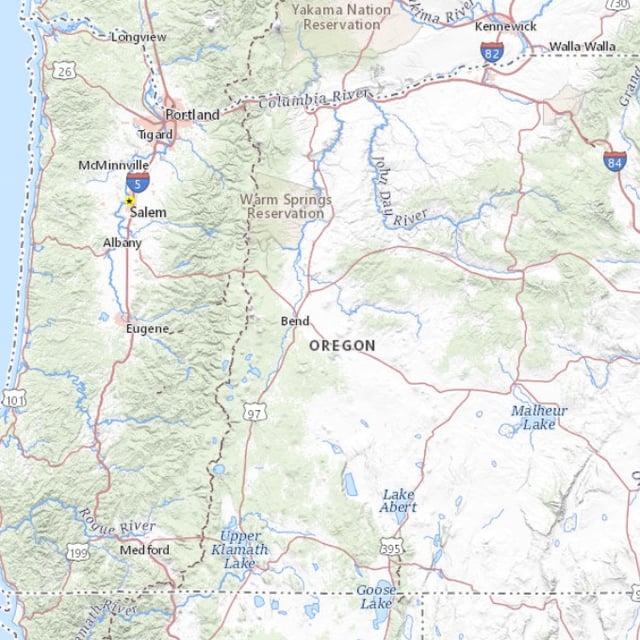
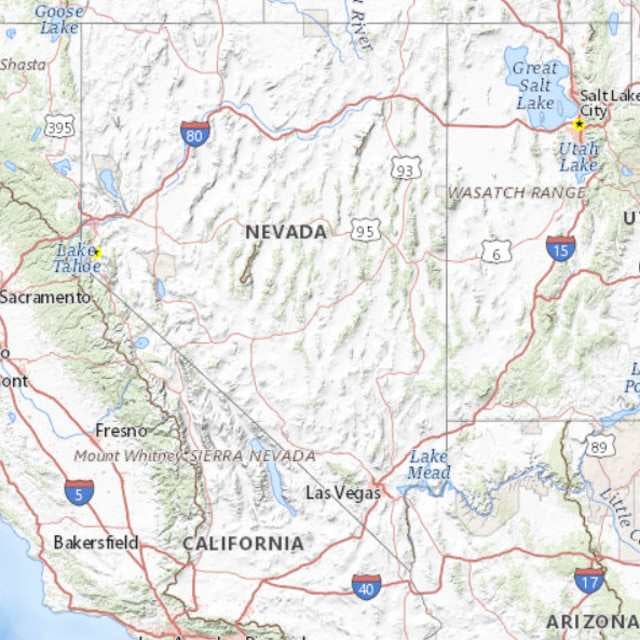
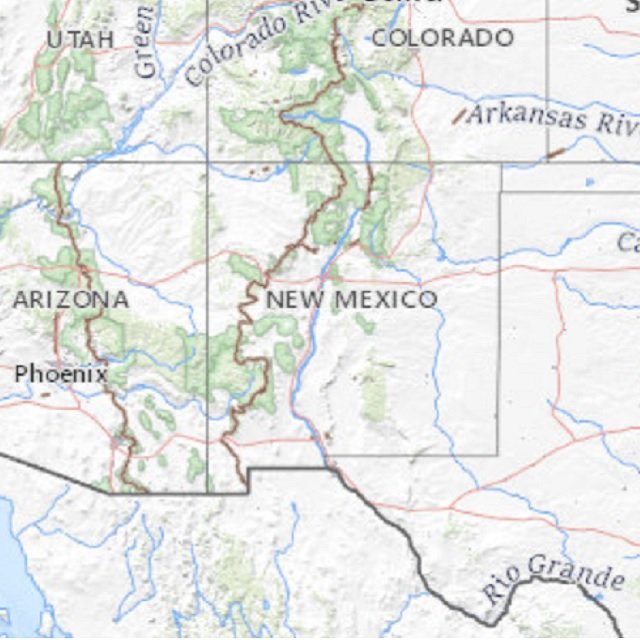
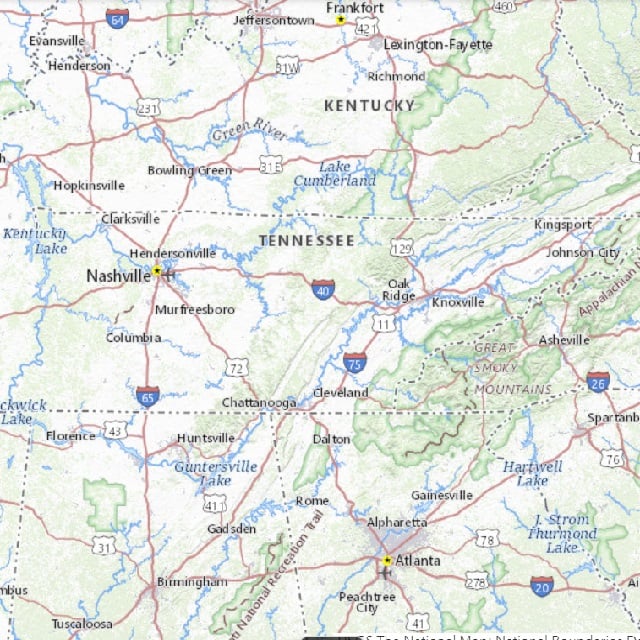
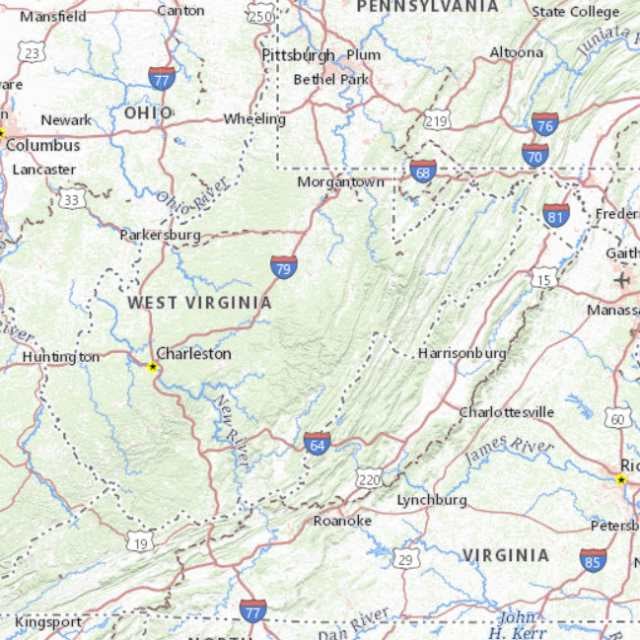
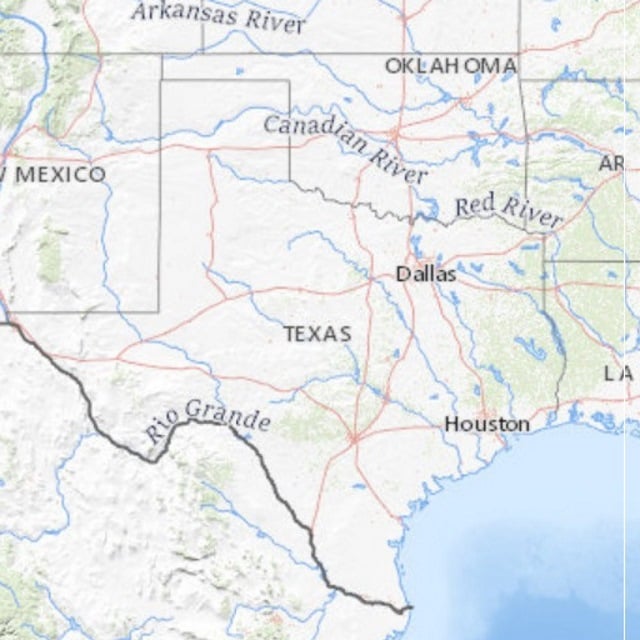
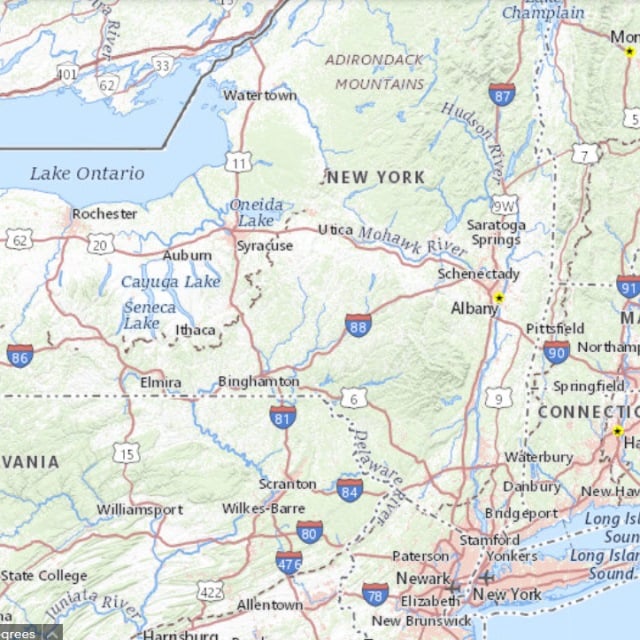
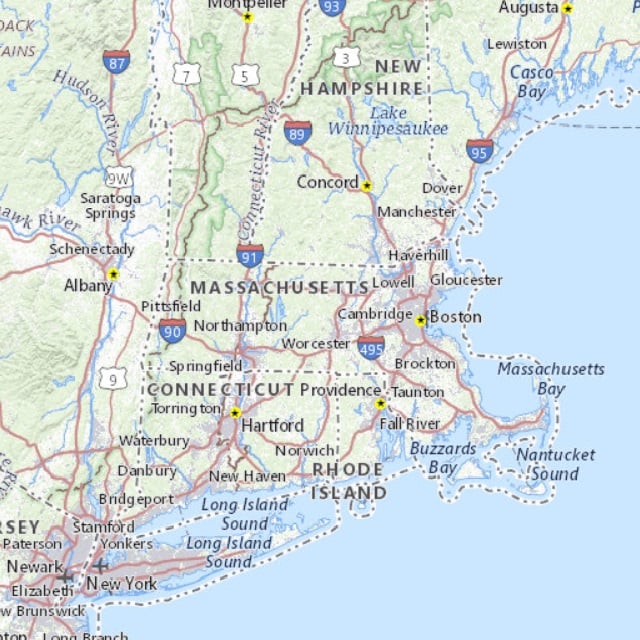
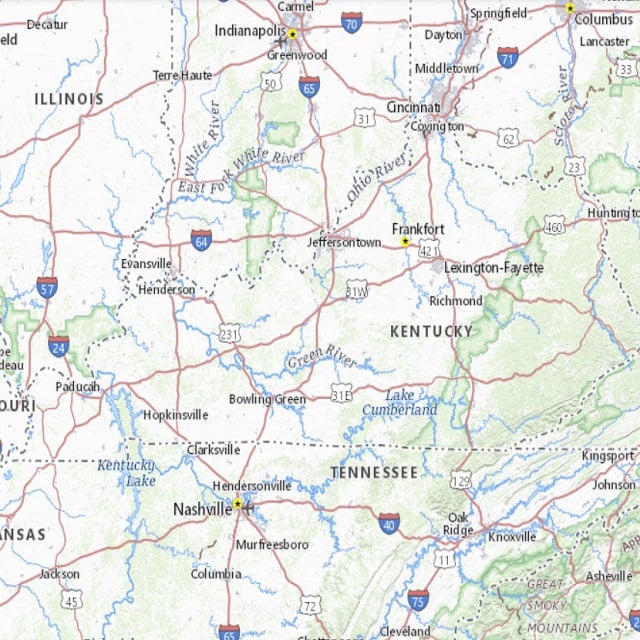
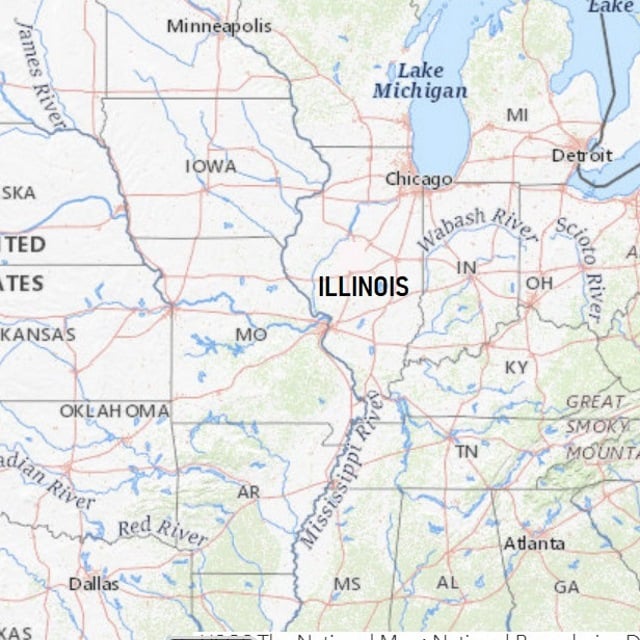
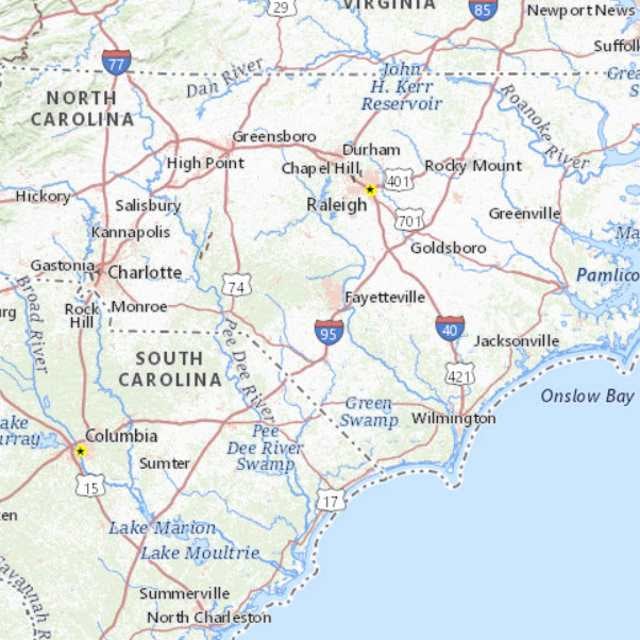
For a look at the 12 states with the biggest improvement, see the gallery above. For data on all 50 states, see the table below.
What It Means
Clients need to think about the risk of premature death, due to the pandemic and many other causes, but, because people who look after their finances tend to be good about looking after their health, they may face about as much longevity risk as they did before January 2020.
Methods
The rankings and table here are based on data from the CDC’s Behavioral Risk Factor Surveillance System survey program. The BRFSS team interviews 400,000 U.S. residents 18 and older every year.
Some of the questions are about drinking. The BRFSS team defines a heavy drinker as an adult man who drinks more than 14 drinks per week and a woman who drinks more than seven drinks per week.
Users can break the data down by many factors. We used having a college degree as a sign of financial well-being to avoid letting temporary, pandemic-related changes in household income throw off comparisons.
States
In 2021, the raw college grad heavy-drinker rates ranged from 3%, in Utah, up to 8.5% in Maine and Vermont.
The CDC includes the District of Columbia in the state data. The district had 10.2% 2021 college grad heavy-drinker rate.
College Grads’ Heavy-Drinker Rates
… |
2021… |
2019… |
Change, in percentage points… |
|---|---|---|---|
| …Alabama… | …5.2%… | …5.6%… | …-0.4… |
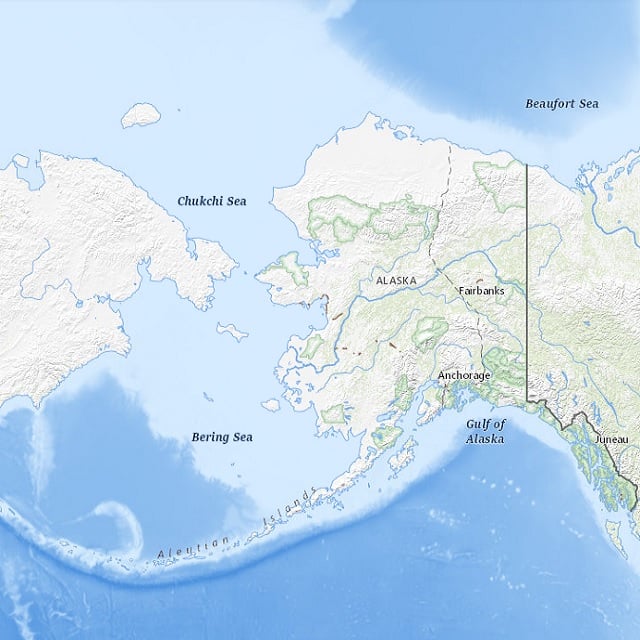
| …Alaska… | …7.1%… | …9.9%… | …-2.8… |
| …Arizona… | …6.3%… | …5.3%… | …1.0… |
| …Arkansas… | …5.2%… | …5.5%… | …-0.3… |
| …California… | …5.8%… | …5.8%… | …0… |
| …Colorado… | …7.7%… | …6.8%… | …0.9… |
| …Connecticut… | …5.8%… | …6.4%… | …-0.6… |
| …Delaware… | …4.6%… | …4.6%… | …0… |
| …District of Columbia… | …10.2%… | …8.9%… | …1.3… |
| …Florida… | …NA… | …8.2%… | …NA… |
| …Georgia… | …5.8%… | …5.4%… | …0.4… |
| …Hawaii… | …6.5%… | …7.1%… | …-0.6… |
| …Idaho… | …6.7%… | …6.9%… | …-0.2… |
| …Illinois… | …5.1%… | …7.4%… | …-2.3… |
| …Indiana… | …5.5%… | …5.6%… | …-0.1… |
| …Iowa… | …6.4%… | …6.0%… | …0.4… |
| …Kansas… | …5.6%… | …5.4%… | …0.2… |
| …Kentucky… | …5.2%… | …7.7%… | …-2.5… |
| …Louisiana… | …8.0%… | …8.4%… | …-0.4… |
| …Maine… | …8.5%… | …8.4%… | …0.1… |
| …Maryland… | …5.1%… | …5.4%… | …-0.3… |
| …Massachusetts… | …5.7%… | …8.0%… | …-2.3… |
| …Michigan… | …6.8%… | …6.4%… | …0.4… |
| …Minnesota… | …6.0%… | …6.7%… | …-0.7… |
| …Mississippi… | …5.2%… | …4.8%… | …0.4… |
| …Missouri… | …5.3%… | …5.8%… | …-0.5… |
| …Montana… | …8.2%… | …8.9%… | …-0.7… |
| …Nebraska… | …6.1%… | …5.5%… | …0.6… |
| …Nevada… | …5.2%… | …6.5%… | …-1.3… |
| …New Hampshire… | …7.8%… | …5.9%… | …1.9… |
| …New Jersey… | …5.2%… | …NA… | …NA… |
| …New Mexico… | …4.3%… | …5.6%… | …-1.3… |
| …New York… | …6.2%… | …8.0%… | …-1.8… |
| …North Carolina… | …6.6%… | …6.3%… | …0.3… |
| …North Dakota… | …5.3%… | …5.7%… | …-0.4… |
| …Ohio… | …6.1%… | …6.9%… | …-0.8… |
| …Oklahoma… | …4.6%… | …4.1%… | …0.5… |
| …Oregon… | …7.8%… | …9.1%… | …-1.3… |
| …Pennsylvania… | …5.6%… | …6.0%… | …-0.4… |
| …Rhode Island… | …7.4%… | …6.0%… | …1.4… |
| …South Carolina… | …7.1%… | …9.9%… | …-2.8… |
| …South Dakota… | …5.3%… | …3.1%… | …2.2… |
| …Tennessee… | …6.0%… | …7.5%… | …-1.5… |
| …Texas… | …4.8%… | …6.4%… | …-1.6… |
| …Utah… | …3.0%… | …2.8%… | …0.2… |
| …Vermont… | …8.5%… | …9.2%… | …-0.7… |
| …Virginia… | …5.4%… | …4.9%… | …0.5… |
| …Washington… | …6.9%… | …6.3… | …0.6… |
| …West Virginia… | …4.7%… | …6.2%… | …-1.5… |
| …Wisconsin… | …6.8%… | …6.0%… | …0.8… |
| …Wyoming… | …6.1%… | …4.7%… | …1.4… |
| …MEDIAN… | …5.9%… | …6.25%… | …-0.3… |
(Image: ALM)


 February 24, 2023 at 01:09 PM




 Slideshow


