The current wave of COVID-19 cases has caused a noticeable increase in the number of working-age people who are entering U.S. hospitals with COVID-19 each day.
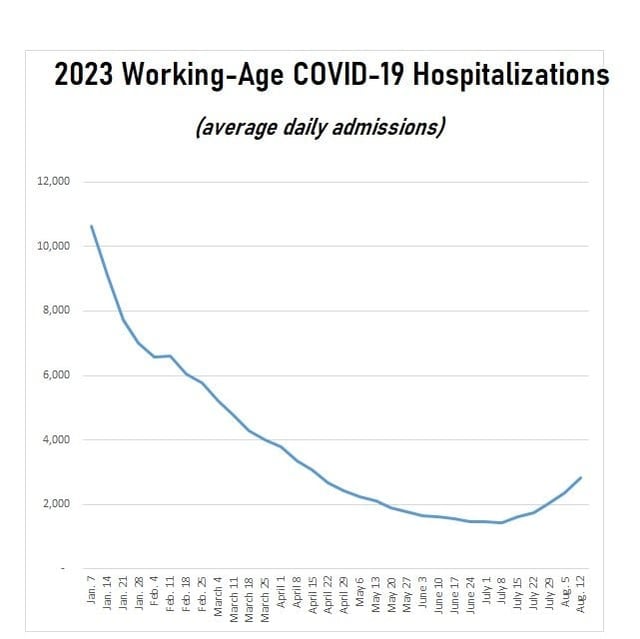
U.S. hospitals reported admitting 2,839 people ages 20 through 59 with confirmed cases of COVID-19 Aug. 11, the day before they provided the hospitalization data posted by the U.S. Centers for Disease Control and Prevention Aug. 18.
That was 20% higher than the total the CDC reported Aug. 11, 75% higher than the figure for July 15, and 84% higher than the figure for June 17, when COVID-19 seemed to be fading away.
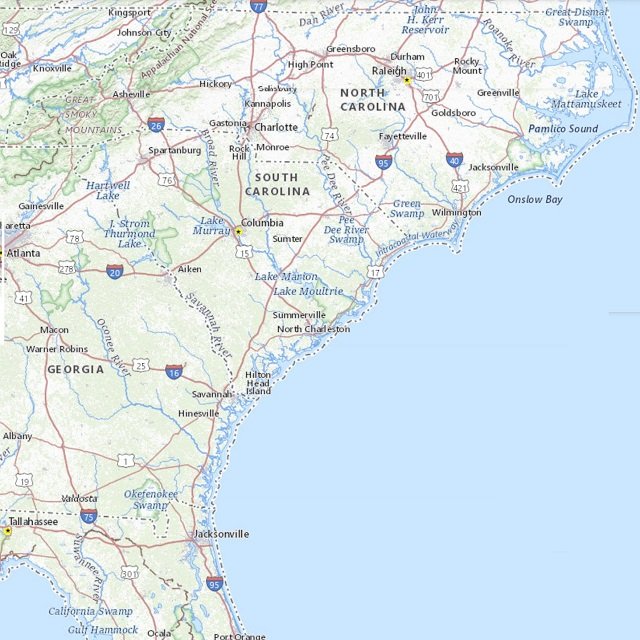
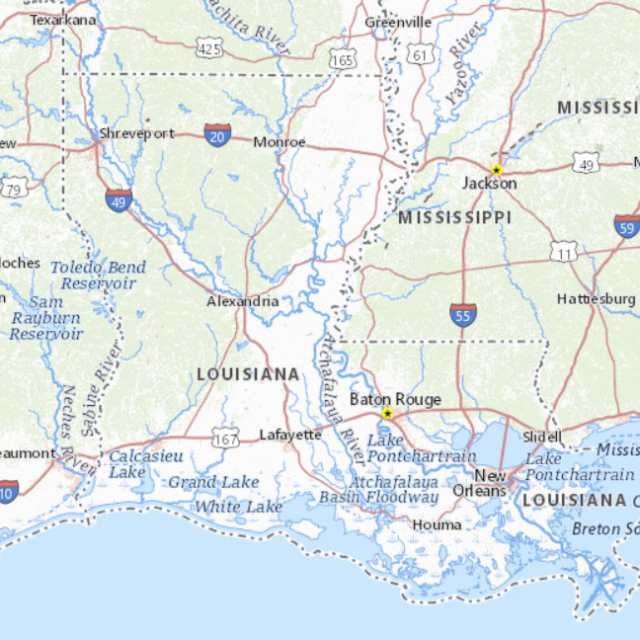
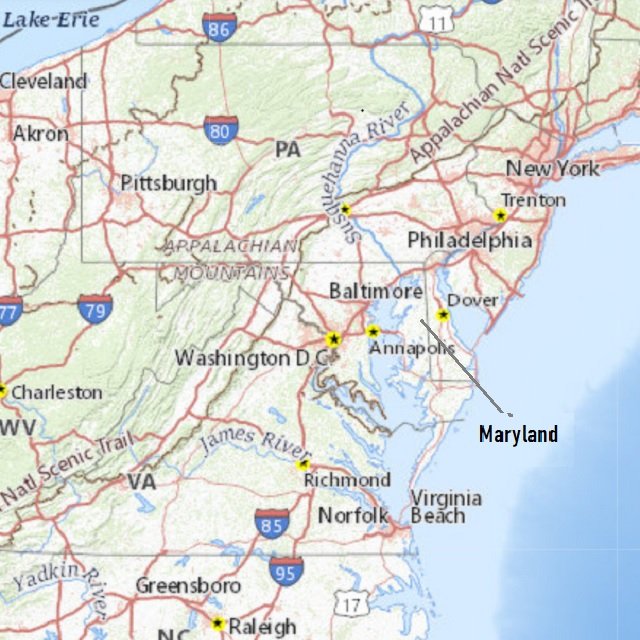
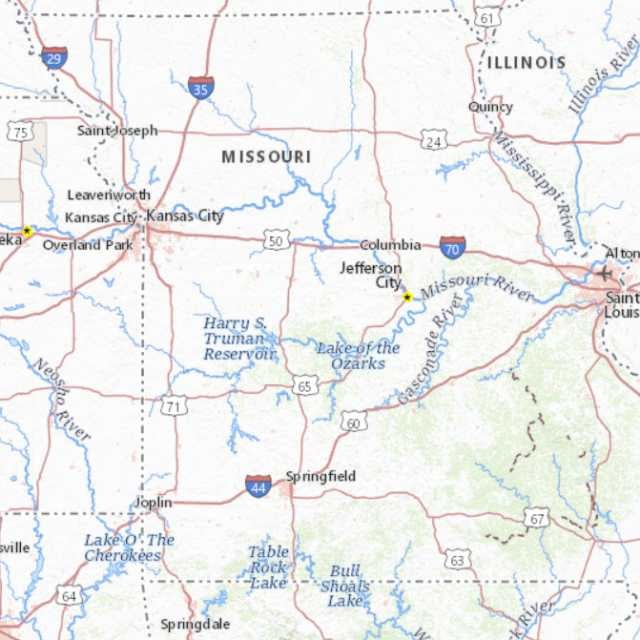
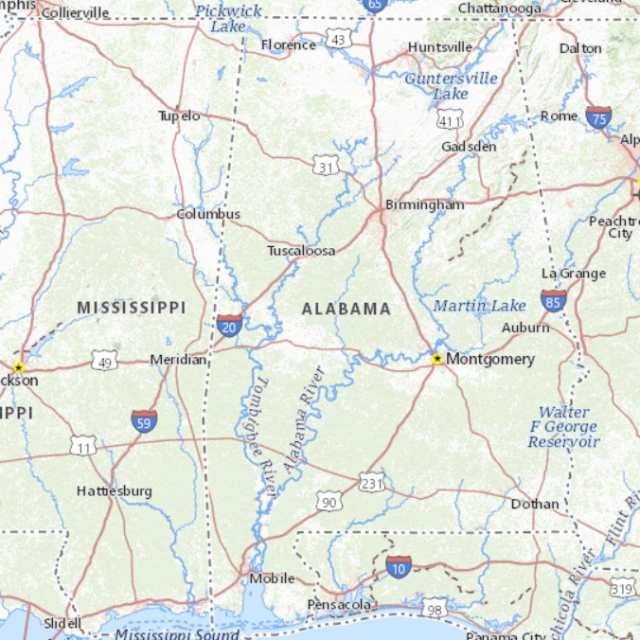
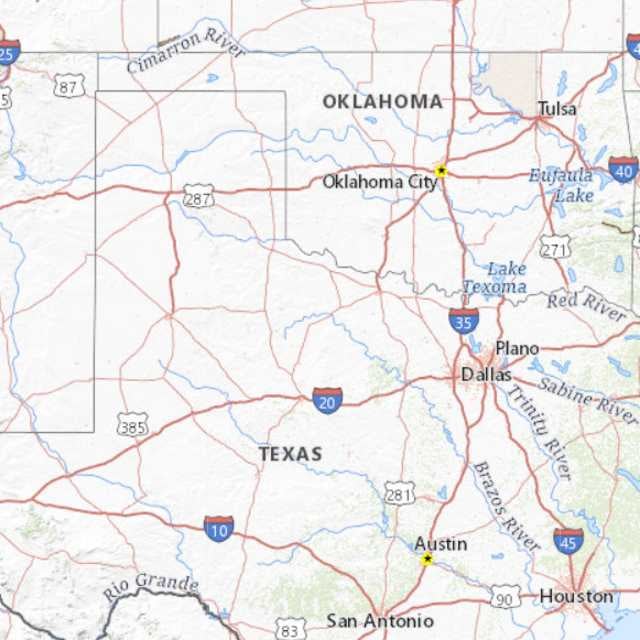
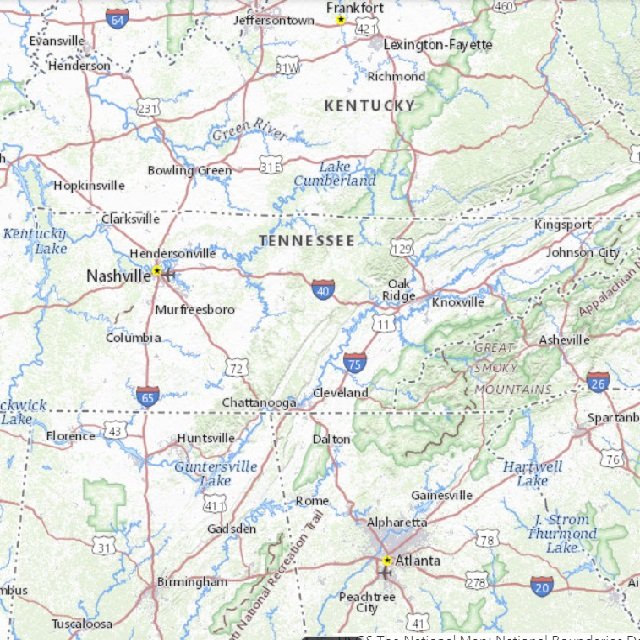
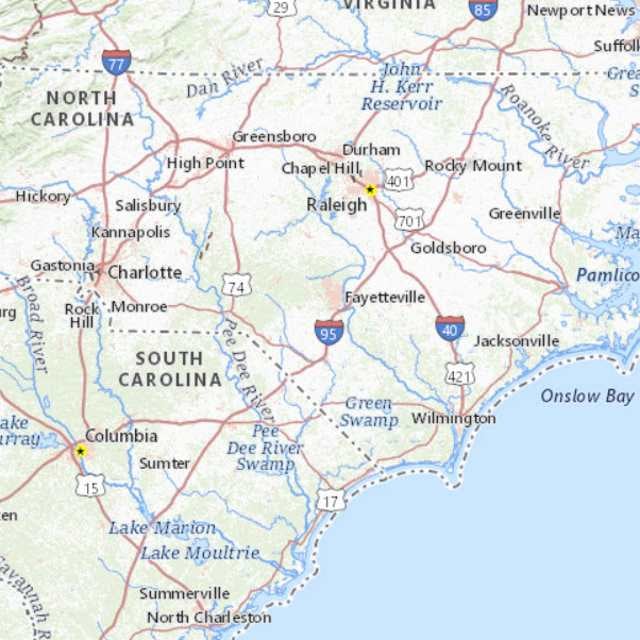
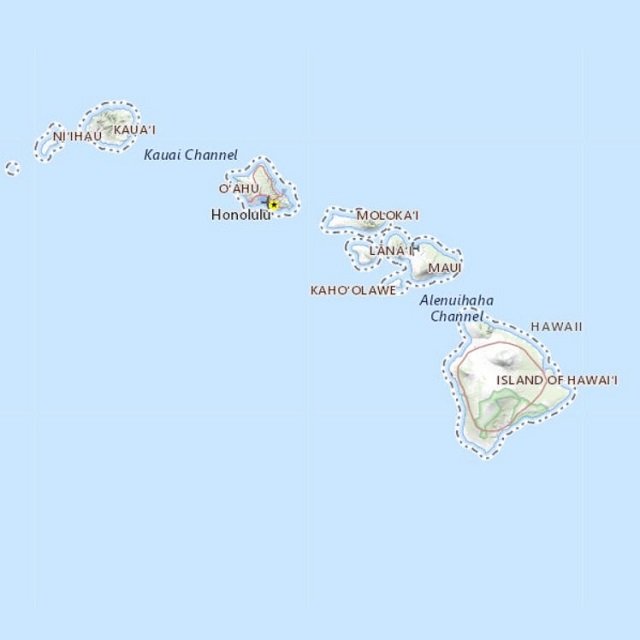
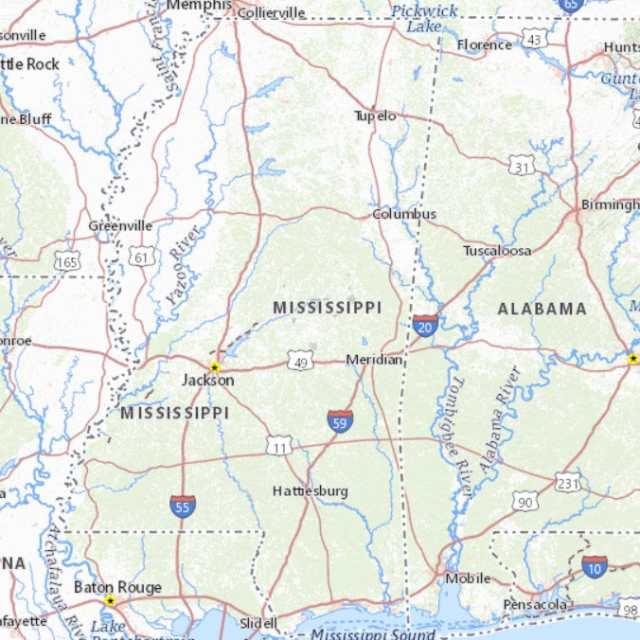
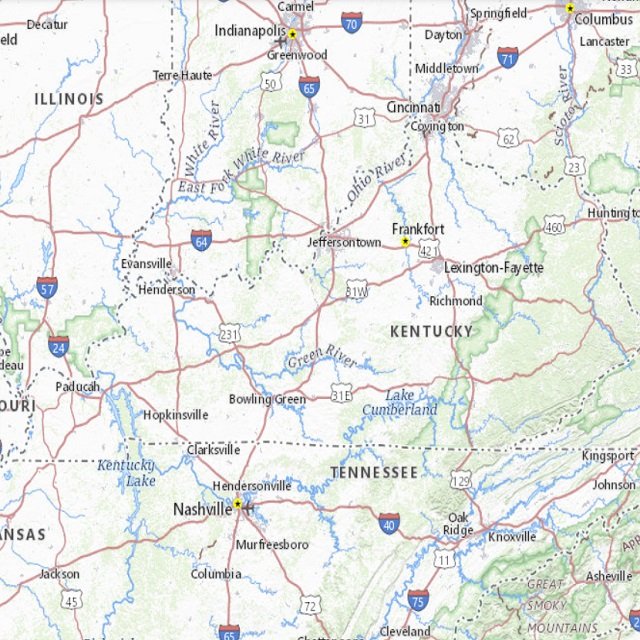
In 12 states, the number of reported working-age COVID-19 hospitalizations increased by more than 165% between mid-June and this past Friday.
In the median state, working-age COVID-19 hospitalizations increased by 77% over that period.
For a look at those states, see the gallery above. For data on all 50 states, the District of Columbia and Puerto Rico, see the chart below.
The gallery and the chart show the COVID-19 hospitalization rate for people ages 20 through 59, per 1,000 inpatient hospital beds in the state. That means that a rate for a low-population state, like Wyoming, can be compared with the rate for a high-population state, like California.
To show how the rates have changed over time, we compare the newest available hospitalization rates for the rates published June 17, or eight weeks earlier.
What It Means
Whether COVID-19 will go away soon and stop raising questions about its possible impact on life expectancy is unclear.
The Context
The new working-age hospitalization rate is still far below the comparable figures recorded during the deadly surge that hit in January.
For the week ending Jan. 21, for example, hospitals reported admitting 7,720 COVID patients ages 20 to 59 the day before they provided their admissions data.
Vermont could have ranked first in terms of its working-age hospitalization increase, because its percentage change was infinite — because the number of working-age hospitalizations there increased to four in the latest week, from zero in mid-June.
But the latest working-age hospitalization increase figure is similar to what the CDC is reporting for the general population.
Overall hospital admissions increased 22% last from the total reported for the previous week, according to the CDC’s COVID Data Tracker. The number of deaths increased 8.3%.
Working-Age COVID-19 Hospitalization Rates…
| Patients ages 20-59 admitted with confirmed COVID-19 per 1,000 inpatient hospital beds | ||||||
|---|---|---|---|---|---|---|
| Inpatient hospital beds | May 20 (Week 20) | June 17 (Week 24) | July 15 (Week 28) | Aug. 12 (Week 32) | Change between June 17 and Aug. 12 | |
| Alabama… | …12,300… | …2.0… | …1.6… | …3.6… | …5.0… | …+210.0%… |
| Alaska… | …1,359… | …1.5… | …4.4… | …2.9… | …5.9… | …+33.3%… |
| Arizona… | …14,457… | …3.6… | …2.1… | …2.4… | …1.7… | …-16.7%… |
| Arkansas… | …7,599… | …2.2… | …1.8… | …1.8… | …2.9… | …+57.1%… |
| California… | …61,862… | …5.9… | …5.5… | …5.1… | …9.0… | …+63.3%… |
| Colorado… | …10,310… | …3.6… | …1.7… | …1.0… | …3.5… | …+100.0%… |
| Connecticut… | …7,512… | …2.4… | …2.9… | …1.6… | …4.3… | …+45.5%… |
| Delaware… | …2,606… | …1.2… | …0.8… | …1.5… | …1.9… | …+150.0%… |
| District of Columbia… | …3,211… | …1.6… | …1.9… | …5.0… | …3.1… | …+66.7%… |
| Florida… | …55,922… | …2.5… | …2.5… | …4.0… | …6.0… | …+135.9%… |
| Georgia… | …20,504… | …2.4… | …2.8… | …2.6… | …6.5… | …+133.3%… |
| Hawaii… | …2,534… | …2.4… | …1.6… | …7.5… | …7.1… | …+350.0%… |
| Idaho… | …2,703… | …4.1… | …1.5… | …2.2… | …2.6… | …+75.0%… |
| Illinois… | …28,422… | …2.7… | …1.9… | …1.4… | …2.8… | …+43.6%… |
| Indiana… | …15,052… | …1.3… | …0.9… | …0.6… | …2.1… | …+146.2%… |
| Iowa… | …7,076… | …1.3… | …0.6… | …0.7… | …1.4… | …+150.0%… |
| Kansas… | …8,048… | …1.0… | …0.6… | …1.2… | …1.2… | …+100.0%… |
| Kentucky… | …11,784… | …1.5… | …0.5… | …1.3… | …3.0… | …+483.3%… |
| Louisiana… | …12,500… | …2.5… | …1.5… | …1.9… | …4.1… | …+168.4%… |
| Maine… | …2,791… | …1.1… | …0.4… | …0.0… | …1.8… | …+400.0%… |
| Maryland… | …10,313… | …1.7… | …1.5… | …1.5… | …4.4… | …+200.0%… |
| Massachusetts… | …16,699… | …2.8… | …1.7… | …1.6… | …3.3… | …+89.7%… |
| Michigan… | …20,305… | …2.4… | …1.5… | …0.9… | …1.8… | …+23.3%… |
| Minnesota… | …9,223… | …1.6… | …1.3… | …1.3… | …1.8… | …+41.7%… |
| Mississippi… | …7,915… | …1.0… | …0.5… | …0.1… | …2.4… | …+375.0%… |
| Missouri… | …14,928… | …2.3… | …0.9… | …0.8… | …2.9… | …+207.1%… |
| Montana… | …2,561… | …3.1… | …0.8… | …0.4… | …2.0… | …+150.0%… |
| Nebraska… | …4,588… | …1.1… | …2.2… | …0.7… | …0.4… | …-80.0%… |
| Nevada… | …7,298… | …3.0… | …1.8… | …1.9… | …3.2… | …+76.9%… |
| New Hampshire… | …2,503… | …2.8… | …2.0… | …2.0… | …2.4… | …+20.0%… |
| New Jersey… | …21,852… | …1.3… | …1.1… | …0.9… | …1.6… | …+47.8%… |
| New Mexico… | …3,749… | …3.2… | …1.3… | …0.5… | …3.5… | …+160.0%… |
| New York… | …45,086… | …2.6… | …2.5… | …2.1… | …4.8… | …+95.5%… |
| North Carolina… | …20,098… | …2.0… | …1.4… | …1.7… | …3.8… | …+165.5%… |
| North Dakota… | …1,952… | …1.0… | …1.5… | …1.0… | …0.0… | …-100.0%… |
| Ohio… | …25,930… | …2.2… | …1.3… | …1.0… | …2.7… | …+112.1%… |
| Oklahoma… | …9,279… | …1.3… | …1.0… | …1.2… | …3.4… | …+255.6%… |
| Oregon… | …6,808… | …2.2… | …2.4… | …3.2… | …3.1… | …+31.3%… |
| Pennsylvania… | …30,910… | …2.0… | …1.3… | …1.5… | …2.7… | …+112.8%… |
| Puerto Rico… | …6,156… | …3.1… | …5.7… | …5.4… | …3.6… | …-37.1%… |
| Rhode Island… | …2,188… | …2.3… | …1.8… | …1.4… | …1.4… | …-25.0%… |
| South Carolina… | …9,943… | …1.6… | …1.2… | …2.5… | …5.0… | …+316.7%… |
| South Dakota… | …2,068… | …1.5… | …1.5… | …0.0… | …1.0… | …-33.3%… |
| Tennessee… | …18,073… | …1.3… | …0.6… | …0.9… | …2.3… | …+272.7%… |
| Texas… | …55,671… | …4.1… | …3.2… | …3.6… | …5.4… | …+67.4%… |
| Utah… | …5,844… | …5.1… | …3.8… | …3.3… | …2.4… | …-36.4%… |
| Vermont… | …1,182… | …0.8… | …0.0… | …0.0… | …3.4… | …Not …meaningful… |
| Virginia… | …16,936… | …0.9… | …1.9… | …1.6… | …2.4… | …+28.1%… |
| Washington… | …11,057… | …3.3… | …2.8… | …4.6… | …4.5… | …+61.3%… |
| West Virginia… | …4,888… | …1.6… | …1.2… | …0.4… | …2.0… | …+66.7%… |
| Wisconsin… | …11,462… | …3.7… | …2.7… | …1.6… | …2.2… | …-19.4%… |
| Wyoming… | …1,273… | …3.9… | …6.3… | …6.3… | …6.3… | …0%… |
| TOTAL… | …697,290… | …… | …… | …… | …… | …… |
| MEDIAN… | …… | …2.2… | …1.6… | …1.6… | …2.9… | …+76.9%… |
Credit:: iStock


 August 22, 2023 at 01:14 PM





 Slideshow


