In October 1989, a 7.1-magnitude earthquake now known as “the little big one” shook northern California just as Oakland and San Francisco were starting Game 3 of the World Series. The double-decker Nimitz Freeway in Oakland buckled and collapsed, killing 41 of the 63 people who died in the quake.
In the following weeks, the New York Times investigated the questions on many people’s minds — did California officials know the freeway wouldn’t survive a strong earthquake? Should they have known or at least suspected it? If its integrity was suspect, why were actions not taken to strengthen or close it down? The investigation exposed both structural deficiencies and political delays that contributed to what may have been a preventable disaster.
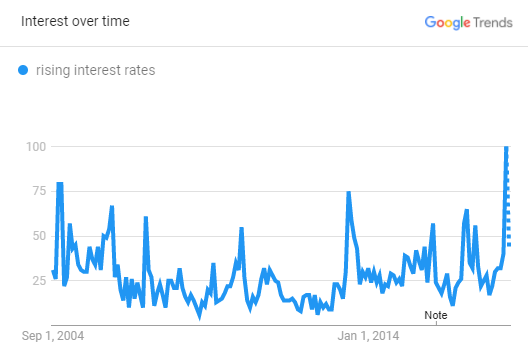
While it was impossible to know ahead of time exactly how each structure and roadway would respond to a major earthquake, state officials had been warned about the general risks and failed to take proper precautions. Similarly, we’ve heard rumblings several times in the last decade that interest rates were on the cusp of rising from their near-zero recessionary levels, but it’s actually starting to happen now. In February, Google searches for “rising interest rates” hit the highest level since 2004. The borrowing, lending, investing public senses change is afoot.

Interest rates are, at their simplest, the price of money, so the potential ripple effects from rising rates will reach across the financial markets. But let’s focus on the epicenter — fixed income. It’s common knowledge that bond prices move inversely with interest rates, but factors like maturity date, issuer leverage, or industry exposure all influence how exposed a particular bond, company or sector is to interest rates. So which parts of the market are most vulnerable today, and what can you do to shore up your clients’ portfolios?
For starters, net leverage for the median S&P 500 company is at 1.6x, the highest level in more than 40 years, fueled by the low cost of issuing and carrying debt over the last decade. The headline leverage number is well off its historic highs, but the weighted average is skewed lower by the high concentration of cash among a few of the biggest and highest-quality borrowers in the index (think Amazon, Microsoft, Apple, Google, and Berkshire Hathaway). BBB issues also make up a growing share of the investment-grade mix as large caps have levered up to fund buyback programs and M&A.
While investment-grade companies have partaken in the cheap debt buffet and will feel some financial indigestion from rising rates, they aren’t likely to become distressed even if we were to see simultaneously higher rates and deteriorating economic conditions.
The same can’t be said of high-yield issuers, however, most of which are small-cap companies. From both an interest rate risk and a credit risk perspective, the US high-yield corporate debt market looks as risky as it has in years. These metrics should act as red flags for investors:
1. Historically high small-cap leverage.


 April 11, 2018 at 03:10 PM


 Mark is a co-founder of Intrepid Capital. He is also the lead portfolio manager of the Intrepid Capital Fund, the Intrepid Disciplined Value Fund, the separately managed Intrepid Balanced and Intrepid Disciplined Value portfolios and the Intrepid Capital, L.P. He has over 30 years of experience in asset management. Mark received his B.A. in economics from the University of Georgia. Travis serves on the Board of Trustees of The Bolles School and the Board of Directors of Jacksonville Clay Target Sports. He is also a member of the Ponte Vedra Rotary Club and YPO-WPO.