Podcast Center
 Video Center
 Webcasts
 Resource Center
 Events


 By
By  January 27, 2022 at 02:23 PM


The Federal Reserve looks as if it’s about to start increasing the interest rate benchmarks it controls “soon.”
For people who help clients use annuities to save for retirement, that’s a sign to get ready for the possibility of explosive sales growth.
U.S. life insurers invest heavily in high-grade corporate bonds to support the benefits guarantees built into annuity contracts that offer any kind of benefits guarantees. Big, random swings in rates could hurt annuity issuers, by kneecapping the economy and causing financial headaches for customers.
But modest, steady increases in rates should help annuity issuers, by increasing what they earn on new investments in bonds.
Life insurers would suddenly have an easier time meeting the obligations associated with annuities, life insurance policies, long-term care insurance policies and other policies issued in the past.
Insurers could use the new, higher-paying bonds to add guarantees to new annuity contracts.
The Prospect Filter
One question might be: Where are the most, best prospects for the richer annuities that could, possibly, appear after the predicted Fed interest rate spring rains?
The logical place to start could be households headed by people ages 45 through 64, with annual income of $100,000 or more.
Another answer might be that the best place to start with annuity marketing is the cradle. If toddlers can recognize the Aflac Duck and the Geico Gecko, why not the Annuity Ant, or the Income Planning Iguana?
Certainly, many people ages 65 and older buy annuities.
But people ages 45 through 64 are old enough to understand that they could grow up enough to retire someday, and young enough that they might not already be locked into a relationship with another source of income planning advice.
The Secrets of the Census
The Census Bureau has information about householder ages and income in the B19037 spreadsheets, which provide household income data collected by the bureau’s American Community Survey program.
The latest numbers available at press time were for 2019.
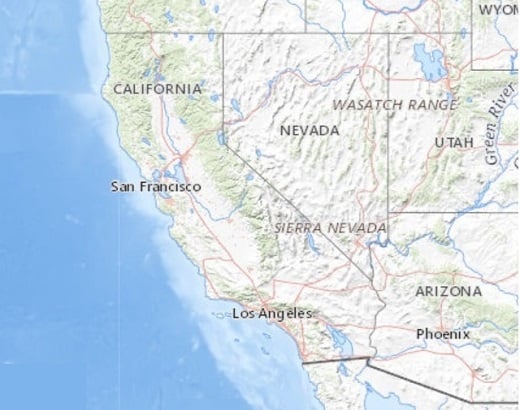
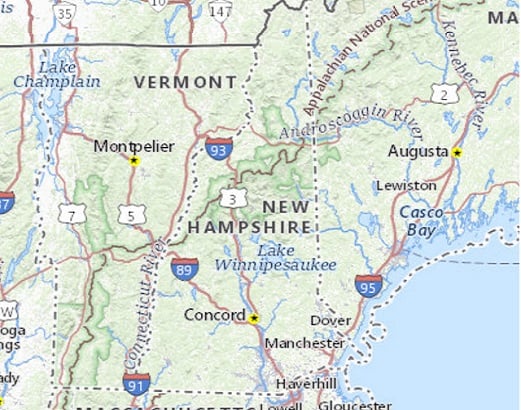
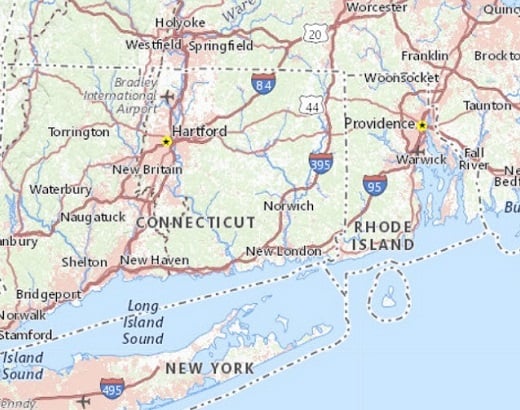
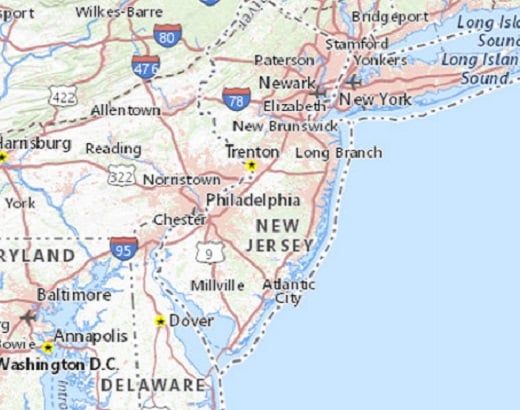
For a look at the seven states with the highest percentage of householders headed by people ages 45 through 64, with annual household income of $100,000 or higher, see the gallery above.
The prime annuity prospect percentage ranges from 2.6% in Puerto Rico, and 9% in Mississippi, to more than 20% in three states on the East Coast.
For data on all 50 states, the District of Columbia and Puerto Rico, see the data table below.
A user can get the kind of data used to create the data table either through the Census Bureau’s online dashboard system or by downloading specific spreadsheets.
The online system, for example, can deliver state-by-state data.
A user can also get data for other “geographies.”
An agent in Abilene, Texas, could get data specifically for the Abilene, Texas, metropolitan area, or for all Census Bureau “places” in Texas.
Users who download the bureau’s data spreadsheets can slice and dice the data in many ways.
The B19037 spreadsheet offers data for income groups ranging from under $10,000 to over $200,000. Users who want to try to market annuities to households with income from $40,000 to $44,999, or to households with annual income of $150,000 or higher, could use the spreadsheets, and math, to come up with prospect counts based on their own income filters.
Users with the ability to handle very large sets of data can analyze the American Community Survey results in still more ways, by downloading slices of microdata, or data for individual people and housing units, and coming up with their own rules for sorting and classifying the microdata.
One issue is that many of the figures in the Census Bureau’s tables are based on estimates, and the numbers for smaller, lower-population areas tend to have large margins of error. The numbers are better for getting a sense of where households in certain groups might be more common that for determining just how many high-income people ages 45 through 64 live on your block.
High-Income Householders Who Are Ages 45 Through 64, by State
| Total Number of Households | Householders, Ages 45-64 | Householders, Ages 45-64, with Annual Household Income Over $100,000 | High-Income Householders, Ages 45-64. as a Percentage of Total Population | |
|---|---|---|---|---|
| Alabama | 1,897,576 | 709,721 | 214,318 | 11.3% |
| Alaska | 252,199 | 98,716 | 43,931 | 17.4% |
| Arizona | 2,670,441 | 936,909 | 338,928 | 12.7% |
| Arkansas | 1,163,647 | 420,592 | 107,036 | 9.2% |
| California | 13,157,873 | 5,031,316 | 2,391,200 | 18.2% |
| Colorado | 2,235,103 | 796,344 | 378,489 | 16.9% |
| Connecticut | 1,377,166 | 552,895 | 271,371 | 19.7% |
| Delaware | 376,239 | 141,483 | 58,921 | 15.7% |
| District of Columbia | 291,570 | 86,954 | 43,681 | 15.0% |
| Florida | 7,905,832 | 2,917,765 | 951,592 | 12.0% |
| Georgia | 3,852,714 | 1,479,988 | 541,897 | 14.1% |
| Hawaii | 465,299 | 165,720 | 81,167 | 17.4% |
| Idaho | 655,859 | 233,118 | 77,768 | 11.9% |
| Illinois | 4,866,006 | 1,808,871 | 749,622 | 15.4% |
| Indiana | 2,597,765 | 970,046 | 323,896 | 12.5% |
| Iowa | 1,287,221 | 447,079 | 155,027 | 12.0% |
| Kansas | 1,138,329 | 402,174 | 145,724 | 12.8% |
| Kentucky | 1,748,732 | 653,149 | 180,463 | 10.3% |
| Louisiana | 1,741,076 | 633,566 | 183,124 | 10.5% |
| Maine | 573,618 | 223,352 | 73,167 | 12.8% |
| Maryland | 2,226,767 | 888,537 | 470,133 | 21.1% |
| Massachusetts | 2,650,680 | 1,023,349 | 541,819 | 20.4% |
| Michigan | 3,969,880 | 1,516,163 | 523,233 | 13.2% |
| Minnesota | 2,222,568 | 813,146 | 367,057 | 16.5% |
| Mississippi | 1,100,229 | 416,406 | 99,157 | 9.0% |
| Missouri | 2,458,337 | 887,049 | 291,701 | 11.9% |
| Montana | 437,651 | 151,472 | 48,242 | 11.0% |
| Nebraska | 771,444 | 264,946 | 94,410 | 12.2% |
| Nevada | 1,143,557 | 416,273 | 151,398 | 13.2% |
| New Hampshire | 541,396 | 223,745 | 105,076 | 19.4% |
| New Jersey | 3,286,264 | 1,338,226 | 700,579 | 21.3% |
| New Mexico | 793,420 | 285,587 | 78,256 | 9.9% |
| New York | 7,446,812 | 2,853,523 | 1,249,972 | 16.8% |
| North Carolina | 4,046,348 | 1,523,116 | 496,913 | 12.3% |
| North Dakota | 323,519 | 99,660 | 38,741 | 12.0% |
| Ohio | 4,730,340 | 1,765,911 | 589,413 | 12.5% |
| Oklahoma | 1,495,151 | 519,595 | 155,050 | 10.4% |
| Oregon | 1,649,352 | 575,175 | 224,010 | 13.6% |
| Pennsylvania | 5,119,249 | 1,942,641 | 733,525 | 14.3% |
| Puerto Rico | 1,170,982 | 445,980 | 30,041 | 2.6% |
| Rhode Island | 407,174 | 165,446 | 70,605 | 17.3% |
| South Carolina | 1,975,915 | 735,182 | 228,310 | 11.6% |
| South Dakota | 353,799 | 122,449 | 41,441 | 11.7% |
| Tennessee | 2,654,737 | 987,649 | 308,587 | 11.6% |
| Texas | 9,985,126 | 3,677,063 | 1,389,114 | 13.9% |
| Utah | 1,023,855 | 332,649 | 156,687 | 15.3% |
| Vermont | 262,767 | 100,374 | 36,381 | 13.8% |
| Virginia | 3,191,847 | 1,215,016 | 569,922 | 17.9% |
| Washington | 2,932,477 | 1,045,353 | 504,852 | 17.2% |
| West Virginia | 728,175 | 267,690 | 66,804 | 9.2% |
| Wisconsin | 2,386,623 | 882,622 | 327,145 | 13.7% |
| Wyoming | 233,128 | 80,506 | 29,253 | 12.5% |
| TOTAL | 123,973,834 | 46,272,257 | 18,029,149 | x |
| AVERAGE | x | x | x | 13.8% |
| MEDIAN | x | x | x | 13.0% |
x
(Image: rawpixel.com/Adobe Stock)


 Slideshow