Close Close
Popular Financial Topics Discover relevant content from across the suite of ALM legal publications From the Industry More content from ThinkAdvisor and select sponsors Investment Advisor Issue Gallery Read digital editions of Investment Advisor Magazine Tax Facts Get clear, current, and reliable answers to pressing tax questions
Luminaries Awards
ThinkAdvisor

Life Health > Health Insurance > Life Insurance Strategies

50 States of New Total Death Ratio Data

X
Your article was successfully shared with the contacts you provided.
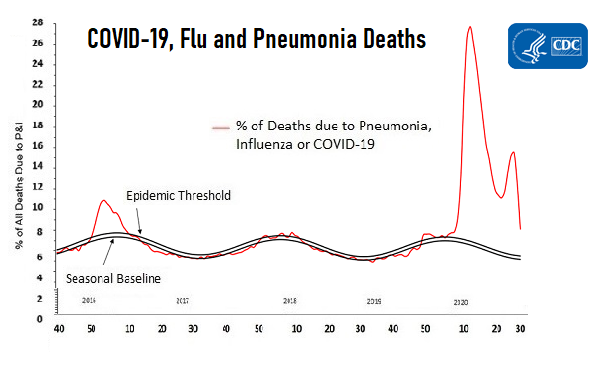
A line chart showing that COVID-19 and COVID-19 look-alike deaths continue to account for an epidemic-level share of all U.S. deaths, even though the share is lower than in April. (Credit: CDC)

The latest COVID-19 tracking numbers from the U.S. Centers for Disease Control and Prevention (CDC) show that U.S. death counts continue to be about 10% higher than the expected numbers.

The United States records about 2.8 million deaths per year in an ordinary year, and an average of about 54,000 deaths per week. If the overall U.S. death total stayed about 10% higher than normal, that would mean the United States was recording about 5,500 excess deaths per week, and about 22,000 excess deaths per month.

The CDC provides total death numbers, and actual-to-expected ratios, for both the country as a whole and individual deaths, to compensate for challenges with COVID-19 testing and testing data.

Resources

The CDC has based its reporting system for COVID-19 on the reporting system it uses for influenza, and it generally assumes that early cases of COVID-19 will resemble the flu.

The agency depends on states to report the death data and other, related figures, and each state sends in numbers in its own format, on its own schedule. Because of the data reporting delays and inconsistencies, the death numbers take at least a month to start to firm up.

The very latest CDC death numbers, for the week ending Aug. 13, show that the ratio of deaths resulting from COVID-19 and conditions that look like COVID-19, such as flu and pneumonia, soared to about 16% during the week ending July 25, or the 30th week of the CDC’s influenza reporting year. That’s about twice the epidemic level for the ratio of deaths from flu-like illnesses to total deaths.

Aside from April and May, when a severe epidemic in New York City sent weekly totals there to more than four times the normal levels for four weeks, the national July 25 ratio of deaths from flu-like illnesses to total deaths appears to be the highest since the CDC began reporting the data in that format, and possibly the peak of the 1968 Hong Kong flu.

New York City accounts for about 40% of the population of New York state. When the COVID-19 pandemic was peaking in New York City, the ratio of total deaths to expected deaths increased to more than 50% higher than the usual level for seven weeks,. During the  week ending April 11, the total number of deaths throughout New York state was 2.36 times the expected number.

Connecticut, Delaware, Louisiana, Maryland, Massachusetts, Michigan, New Jersey, Rhode Island and the District of Columbia also had death totals that were 50% higher than normal for two or more weeks. All of those outbreaks eased below the 50% increase threshold by May 30.

As of the week ending July 25, the total number of deaths in Arizona had been at least 50% over the usual number for every week for four weeks, according to the CDC death count data.

During the week ending July 18, in Texas, the number of deaths for the entire state was 55% higher than expected.

In late July, those were the only states with deaths counts more than 50% higher than normal.

The high statewide figures in Arizona and Texas imply that some communities in those states may be roughly as hard hit as cities like Boston and New York City were in April.

Numbers for August are clearly incomplete, and the numbers for July, and even June, could look different as more state comes in

.

Ratio of All Reported Deaths to Expected Deaths

(as of July 18)
Total Deaths Ratio of Actual Deaths to Expected Population
Alabama 1,128 1.17 4,903,185
Alaska 58 0.77 731,545
Arizona 1,915 1.72 7,278,717
Arkansas 665 1.15 3,017,804
California 5,984 1.26 39,512,223
Colorado 782 1.14 5,758,736
Connecticut 184 0.32 3,565,287
Delaware 179 0.98 973,764
District of Columbia 115 0.96 705,749
Florida 5,307 1.43 21,477,737
Georgia 1,795 1.15 10,617,423
Hawaii 200 0.95 1,415,872
Idaho 307 1.23 1,787,065
Illinois 2,040 1.07 12,671,821
Indiana 1,251 1.04 6,732,219
Iowa 566 1.12 3,155,070
Kansas 502 1.05 2,913,314
Kentucky 795 0.93 4,467,673
Louisiana 929 1.13 4,648,794
Maine 293 1.07 1,344,212
Maryland 991 1.09 6,045,680
Massachusetts 1,047 1.02 6,892,503
Michigan 1,817 1.01 9,986,857
Minnesota 805 1.04 5,639,632
Mississippi 734 1.31 2,976,149
Missouri 1,175 1.00 6,137,428
Montana 201 1.03 1,068,778
Nebraska 309 1.05 1,934,408
Nevada 574 1.20 3,080,156
New Hampshire 230 0.97 1,359,711
New Jersey 1,301 0.96 8,882,190
New Mexico 333 1.01 2,096,829
New York 1,826 1.00 19,453,561
New York City 961 0.99 8,336,817
North Carolina 31 0.01 10,488,084
North Dakota 110 0.91 762,062
Ohio 2,276 1.03 11,689,100
Oklahoma 725 1.01 3,956,971
Oregon 697 1.05 4,217,737
Pennsylvania 2,446 1.02 12,801,989
Rhode Island 135 0.69 1,059,361
South Carolina 1,289 1.44 5,148,714
South Dakota 146 1.03 884,659
Tennessee 1,556 1.15 6,829,174
Texas 5,635 1.55 28,995,881
Utah 430 1.19 3,205,958
Vermont 86 0.89 623,989
Virginia 1,337 1.10 8,535,519
Washington 1,156 1.12 7,614,893
West Virginia 43 0.11 1,792,147
Wisconsin 1,013 1.07 5,822,434
Wyoming 95 1.14 578,759
TOTAL 56,505 1.10 336,576,340

.

— Read COVID-19 Might Have Caused $2 Billion in U.S. Life Claims So Faron ThinkAdvisor.

— Connect with ThinkAdvisor Life/Health on FacebookLinkedIn and Twitter.


NOT FOR REPRINT

© 2024 ALM Global, LLC, All Rights Reserved. Request academic re-use from www.copyright.com. All other uses, submit a request to [email protected]. For more information visit Asset & Logo Licensing.


NOT FOR REPRINT

© 2024 ALM Global, LLC, All Rights Reserved. Request academic re-use from www.copyright.com. All other uses, submit a request to [email protected]. For more information visit Asset & Logo Licensing.