Close Close
Popular Financial Topics Discover relevant content from across the suite of ALM legal publications From the Industry More content from ThinkAdvisor and select sponsors Investment Advisor Issue Gallery Read digital editions of Investment Advisor Magazine Tax Facts Get clear, current, and reliable answers to pressing tax questions
Luminaries Awards
ThinkAdvisor
Math

Retirement Planning > Retirement Investing > Annuity Investing

How Fixed Annuities Beat Mutual Funds in a DOL Fiduciary Rule Asset Table

X
Your article was successfully shared with the contacts you provided.

What You Need to Know

  • Labor analysts included a puzzling asset comparison table in the final fiduciary standard update packet.
  • The table shows fixed annuity assets growing twice as fast as mutual fund assets.
  • The numbers look strange to some annuity professionals because the analysts used Fed asset totals, not investment yield data.

Labor Department regulation analysts recently shocked the U.S. fixed annuity community.

The department set tough new retirement account rollover advice fiduciary standard requirements.

The department also reported that, as of 2022, 10-year asset growth had been 6% for fixed annuities, 3% for variable annuities and just 2.9% for mutual funds.

Stocks ranked first, with 10-year asset growth of 10.8%, but humble bank deposits ranked second, with 10-year growth of 6.8%.

Retail investors’ mutual fund assets had a growth rate of 2.9%, while bonds had a negative growth rate, a decrease of 0.5%.

This DOL asset performance table shows that retail investors had $62.5 billion in assets in 2022, with $26.5 billion in equities, $4.6 billion in bonds, $3.1 billion in money market funds, $9.7 billion in mutual funds, $2 billion in variable annuities, $1.7 billion in fixed annuities and $1.48 billion in bank deposits. 10-year compound annual growth, for total retail investor assets, was 10.8% for equities, -0.5% for bonds, 5.8% for money monarket funds, 2.9% for mutual funds, 3% for variable annuities, 6% for fixed annuities, 6.8% for bank deposits and 6.4% for all assets included in the table. 
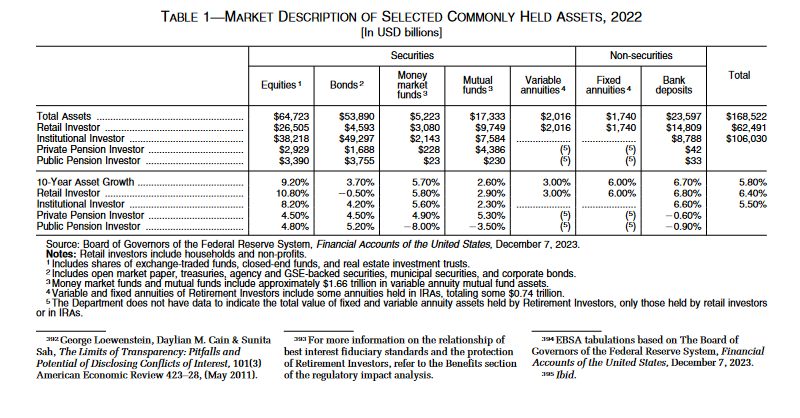
Credit: U.S. Department of Labor’s investment advice fiduciary final rule packet.

Annuity professionals asked each other and ThinkAdvisor: How could fixed annuity assets grow faster than mutual fund assets?

The answer: Labor Department analysts used different kinds of data than retail investment advisors usually use when monitoring product performance.

Retail comparisons: Investment advisors who help clients compare the performance of various types of investments often provide tables or charts that focus on how much the value of a certain asset class has increased or decreased due to market shifts.

For stocks, they might use the S&P 500 stock index or a similar stock index.

The DOL table: Labor Department fiduciary regulation impact analysts included the retirement asset snapshot table to give users a rough idea of what kinds of assets retail investors are using and how the asset totals are changing.

Instead of using the kinds of investment index figures that typically show up in news reports or investment advisor presentations, the department analysts pulled data from the Federal Reserve System’s Financial Accounts of the United States reports.

The Fed publishes the financial accounts reports, which are also known as the Z.1 reports, every three months. The edition the Labor Department impact analysts used was published Dec. 7.

Most of the statistics come from the House and Nonprofit Organizations asset figures in table L.101.

The fixed annuity asset figure is from the life insurance companies’ general account pension entitlements total, from table L.116.g, and the variable annuity figure is the life insurance companies’ separate account pension entitlements total, from table L.116.s.

DOL analysts calculated the 10-year asset growth figures by comparing the December 2022 totals with the totals for 2012 and computing compound annual growth rates.

The comparisons: The DOL’s asset growth comparison table reflects the impact of all factors on asset totals, not just the yields on each type of asset.

In addition to yields, the factors include the flow of retail investor cash into the asset category, the amount of cash that retail investors pulled out, taxes and fees.

Bank deposits grew quickly, for example, because many retail investors kept large amounts of cash in ordinary bank accounts in 2022 due to concerns about stock market volatility.

Fixed annuity assets increased because of low but steady crediting rates, a lack of investment losses and product features that encouraged investors to keep assets in their annuities.

One type of information missing from the DOL table is the number of retail investors who hold each type of asset.

Because of the lack of participant counts, readers cannot use the DOL table or the main version of the Fed Z.1 reports to show how average retail investors’ assets are performing.

Credit: Shutterstock


NOT FOR REPRINT

© 2024 ALM Global, LLC, All Rights Reserved. Request academic re-use from www.copyright.com. All other uses, submit a request to [email protected]. For more information visit Asset & Logo Licensing.