(Related: Homeland Security Department Co-Creator to Lead ACLI)
Census Bureau information is a great, free (!!) tool for any financial professional with an interest in marketing, or shaping public policy. Here’s the fourth in a series of five articles we’re running this week about what key indicators look like when you break the numbers down by U.S. House of Representatives district.
Some U.S. residents ages 65 and older are doing well — because they get income from the kinds of retirement planning products that a financial professional might sell.
The Census Bureau asks about private retirement income every year, through the American Community Survey program. The bureau’s “retirement, survivor and disability income” income category includes income from arrangements such as traditional pension plans, 401(k) plans, 403(b) plans and individual annuities.
You can use the bureau’s American FactFinder tool to get state, metropolitan area and county breakdowns of the data, by slicing and dicing a table that shows how the U.S. population ages 60 years and older is doing. The latest numbers available are for 2016.
You can also break the data down by U.S. House of Representatives district.
If you want to know who to talk to in Congress about matters such as the U.S. Securities and Exchange Commission’s sales standards proposal, that might be a way to identify the lawmakers who already have a reason to be thinking about private retirement income sources.
At the U.S. House district level, the percentage of constituents ages 60 and older “with retirement income” in 2016 ranged from 18.8%, in a district in Los Angeles, up to 64.7%, in a district in Michigan. The median was 49.2%.
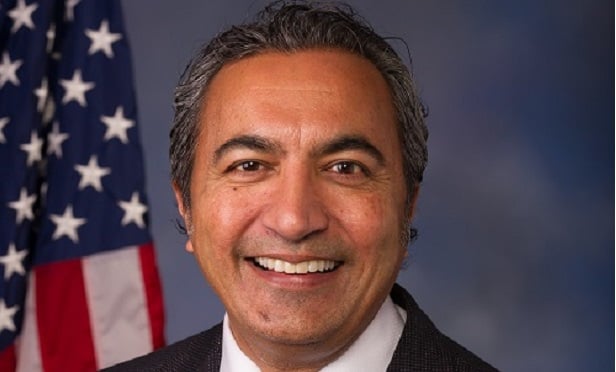
For a look at the five districts with the highest “with retirement income” percentages, and those districts’ representatives, see the idea cards above.
— Read 10 States Where Workers Went to Hell, on ThinkAdvisor.
— Connect with ThinkAdvisor Life/Health on Facebook and Twitter.


 August 30, 2018 at 03:26 AM


 Slideshow


