Podcast Center
 Video Center
 Webcasts
 Resource Center
 Events


 By
By  July 11, 2018 at 04:18 PM


This is the final part of a three-part series on recessions, called Recessionomics. To recap, in Part I we learned that the yield curve is an unreliable predictor of a recession. In Part II, we found unemployment is a better indicator that a recession is present rather than a predictive tool. In this article, we will look closely at how stock prices react prior to, and during a recession. We will also consider the role GDP plays in stock market performance.
In the previous article we revealed that the length of the current economic expansion is second only to the expansion that followed the 1990-91 recession. In fact, if this expansion continues, on June 2, 2019, this will become the longest expansionary period since 1854, seven years before the Civil War began. Due to data limitations, this expansion may become the longest in U.S. history. When will the next recession strike? What can we do to prepare? Most, if not all advisors have a personal interest in these questions. If so, read on as we study the past 118 years of U.S. stock market history.
Recessions: How Long Do They Last?
Exhibit I (below) lists the length of each recession in chronological order with the most recent at the top. This shows that recessions lasted much longer in the early part of the twentieth century. In fact, the four longest recessions occurred prior to the end of the Great Depression.
 Exhibit I–Duration of US Recessions
Recessions and Stocks: An Overview
Most investors understand that stock prices tend to decline during periods of economic weakness. When demand for goods and services softens, businesses seek ways to reduce expenses. To achieve this, they may downsize their workforce, delay pay raises, cut the number of hours worked, and place a freeze on hiring. As this becomes widespread, unemployment rises, aggregate wages fall, demand weakens further, and the economic expansion ends, ushering in the next contraction. This cycle (a.k.a. the business cycle) has been present for as long as the economy has existed.
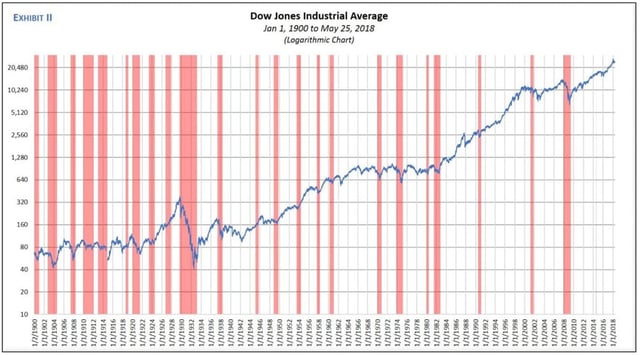
Over the past 118 years, the U.S. has experienced 23 recessions, which includes the Great Depression. The logarithmic chart (Exhibit II) in the gallery above shows each recession (shaded in red), plus the level of the DJIA from January 1, 1900 to May 25, 2018. A cursory view reveals that recessions were very frequent in the early part of the twentieth century. In fact, from January 1, 1900 to the end of the Great Depression (February 28, 1933), slightly over 33 years, the U.S. economy was in recession 47.4% of the time. Clearly, the U.S. economy was much more volatile in the early 1900s. Conversely, in the 85 years since, the economy was in recession 13.9% of the time.
It is interesting to note that even during the two decades following the 1913 creation of the Federal Reserve system, recessions were commonplace. Did it take the Fed that long to develop and improve its methods to effectively execute its mandate? Additionally, why have recessions been less frequent in the post WWII era? One possibility is the advancement of technology. Simply put, the Fed has better and quicker access to economic data, which in theory, should enable it to stay ahead of the curve. If this is correct, then recessions may continue to be less frequent.
Regardless, recessions will continue to be a part of the economic fabric. What does that portend for stock investors? There are additional observations we can glean from the graph. For example, the DJIA declined during every recession with only three exceptions. Those exceptions were the recessions of 1918-19, 1926-27, and 1945. Even so, these anomalies may be explained. First, the recession of 1918-19 was the second shortest of all, lasting only 211 days. Next, the recession of 1926-27 occurred during a time of intense stock speculation, which included a great deal of leverage. Moreover, the top marginal tax rate was slashed from 73% in 1920 to 25% in 1925, providing additional fuel for the stock bubble. Finally, the recession of 1945, severe as it was, may have been overshadowed by the euphoria over the end of WWII. Despite these exceptions, there is a clear trend between recessions and falling stock prices.
Recessions and Stocks: A Deeper Look
Stock prices are influenced by many factors. One key issue is the strength or weakness of the underlying economy. When the economy is strong, consumer and business spending increases and corporate profits improve. Greater profits support higher stock prices. Conversely, when economic activity slows, spending declines, profits wane, and stock prices fall. This is the premise for the stock market valuation indicator that compares total stock market capitalization to GDP. This also elicits some important questions:
- Do stock prices decline before or after a recession begins?
- How accurate are the starting dates of a recession?
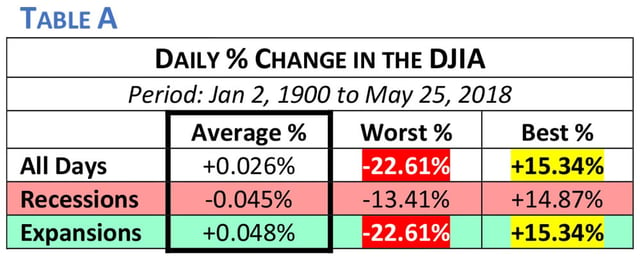
Our focus will be on the first question, as the second falls outside the scope of this article. The following table lends some perspective on the tendencies of the DJIA. There were 31,000 trading days or about 84.9 years of data in our analysis. The average daily percentage change during the entire period was +0.026%. When a recession was present, the average fell to -0.045%. During periods of expansion, the average was a healthy +0.048%. The difference between the average daily percentage change during recessions versus expansions was close to 100 bps, at 0.93%.
The table also shows the best and worst days (in percentage terms) over this period. While it is no surprise that the best day occurred when the economy was expanding, the worst day (October 19, 1987) was also during a period of expansion. Interestingly, the best day (March 15, 1933) was only two weeks after the Great Depression officially ended.
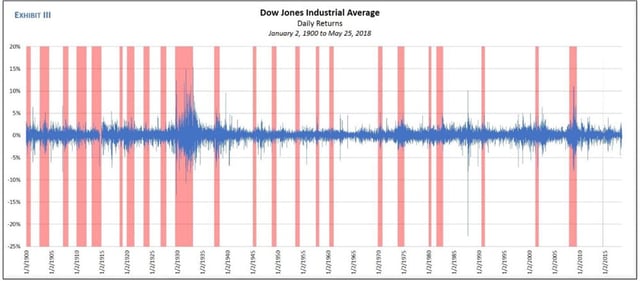
When we cite the average daily percentage changes in the DJIA, we must consider how volatility has changed over this 118-year period. To better understand this, let’s refer to the graph (Exhibit III) in the gallery above. It shows the daily percentage change for all days during the entire period.
Note how the DJIA was more volatile in the earlier years when recession occurred with much greater frequency. Moreover, volatility tends to rise during recessions. The reason for this may be that fear is a stronger emotion than greed. However, because the DJIA experienced significant spikes in volatility during recessions and expansions, we know the economy is not the only factor influencing stock prices. Even so, the health of the U.S. economy is a vital issue.
The Relationship Between Stock Prices and GDP
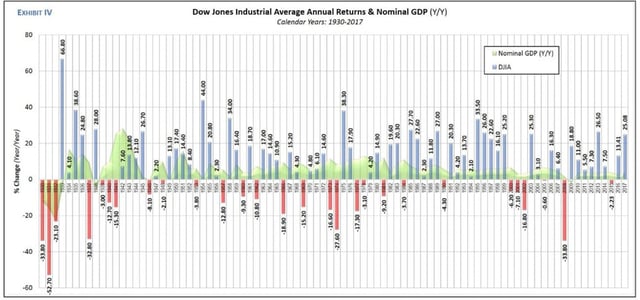
As mentioned earlier, perhaps the most oft-cited ratio for stock market valuation compares total market cap of all U.S. publicly-traded companies to GDP (stock mkt cap / GDP). If total market cap was $20 trillion and GDP was the same, the ratio would be 100% and stocks would be considered fairly-valued. When stock prices rise at a faster rate than GDP they become over-valued. During the Tech-Bubble, this ratio reached 148.6% (March 24, 2000), just as the bubble was about to burst. Until recently, that was its all-time high. On January 26, 2018, it surpassed that mark, hitting 150.7%. As of May 30, 2018, the ratio was 142.4%. In short, stocks are still 42.4% overvalued according to this method. How reliable is this ratio? To examine this issue, let’s refer to the following graph (Exhibit IV), which covers the period from 1930 through 2017 and shows the percentage change in nominal GDP (Y/Y) and the calendar year returns of the DJIA.
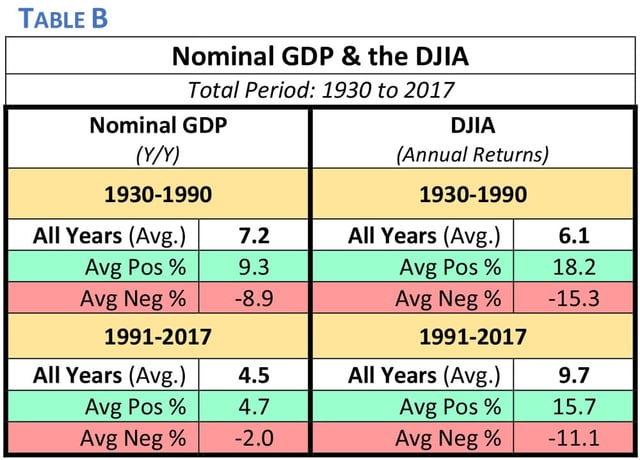
Exhibit IV shows how GDP has been much lower in recent years. Table B provides a closer look at this issue. It divides the entire 87-year period into two parts, 1930-1990 and 1991-2017. In the first period, the average percentage change in GDP was 7.2%. In the latter period, it was 4.5%. Moreover, the average of all positive periods was 9.3% in the first period compared to 4.7% since 1991. The average of all negative periods was -8.9% versus -2.0% for the same periods. As a side note, GDP had only one negative year in the latter period. Therefore, we may conclude there has been less variance in GDP since 1991. This begs the question: Shouldn’t lower GDP lead to lower stock returns? In theory, yes. But there is more to the story.
When we look at the DJIA for the same two periods, we find an interesting observation. Despite a 37.5% reduction in GDP in the latter period (7.2% vs 4.5%), the average calendar year return in the DJIA was substantially higher. In the earlier period it was 6.1% versus 9.7% in the latter period. Why? One reason is increased productivity from the use of technology. As expected, the variance in the DJIA was lower in the latter period. For example, the average of all positive years was 18.2% from 1930 to 1990. After that, it was 15.7%. The same is true for the average of all negative calendar year returns (-15.3% vs -11.1%). There have also been fewer negative calendar year returns since 1991.
Investing During Recessions: Prudent or Perilous?
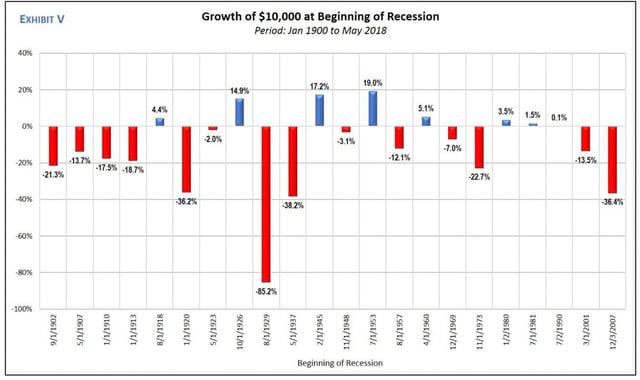
Is it safe to invest during a recession? To answer this, we must look at the performance of the DJIA during each of our recessions. Exhibit V in the gallery above assumes an initial investment of $10,000 at the beginning of each recession. The worst result was a staggering loss of -85.2% during the Great Depression. From its peak September 6, 1929 to its bottom July 8, 1932, the DJIA lost 89%. It did not reach this peak again until 1954, some 25 years later. The average return during all recessions in our analysis was -11.9%. In each recession from 1900 to 1945, the average return was -17.9%. After WWII, the average return during recessions was much less, at only -6.0%.
Earlier, we discussed three recessions, in which the DJIA did not decline. In Exhibit V we find the returns for these exceptions. They were 4.4% (1918-19); 14.9% (1926-27); and 17.2% (1945). In the 1953-54 recession, the DJIA had a small rise in the beginning, then declined, then rose again. By the time the recession ended, it was 19.0% higher than when it began. This was the best performance during any recession.
Summary
Recessions in general are not good for stock prices. However, because there are so many other influencing factors, as long as the recession is not a major crisis or stock bubble, staying the course may be the best strategy. Think of it like white-water rafting. If you can avoid levels five and six, you should be fine. If not, or if the investor doesn’t have the stomach for it, when volatility spikes, they may decide to sell. Although this is emotionally understandable, it can be financially destructive. By the time stocks decline to the point where the investor wants out, it may be closer to the bottom than the top.
As an advisor, bringing this perspective to the client is one more way to add value to the relationship. With today’s, more sophisticated client, it may not be enough to simply say “stay the course.” We may need to provide perspective, so they will be comfortable with it. If this issue is not addressed, and it’s likely the client will get nervous when things get choppy, they should probably not invest. Because fear is a stronger emotion than greed, this is a topic we should discuss with our clients.
After all, we may have the knowledge and historical perspective on the stock market, but rarely have I found a client with the same. Even though we should buy low and sell high, when fear kicks in, it will override logic, and the client will want to exit. Therefore, if we can remove the emotional part of investing (except to understand how it affects investors), we may find it easier to navigate the future. Because this expansion has endured so long, the next recession could be severe. Thus, a little caution may be warranted.


 Slideshow