Podcast Center
 Video Center
 Webcasts
 Resource Center
 Events


 By
By  June 27, 2022 at 03:47 PM


Life insurers are waiting to see: Is this really the end of the acute stage of the COVID-19 pandemic, or just another lull between big waves?
The latest Department of Health and Human Services Community Profile Report, dated June 23, shows that the United States recorded 682,010 known cases of COVID-19 in the seven-day period ending June 22, or 205 cases per 100,000 residents.
But the government also recorded just 1,787 COVID-19-related deaths, or about 1 death per 400 known cases. That’s down from 1 death per 50 known cases in January 2021.
The COVID-19 hospitalization rate began to increase every week five weeks ago, however.
In the seven-day period ending June 21, the hospitalization rate increased to 9.2 per 100,000 residents, up from 9.1 hospitalizations per 100,000 U.S. residents the week before, and up from 4.4 hospitalizations per 100,000 residents during the worst week in April.
In many large and midsize communities, the hospitalization rate was more than 10% higher this past week than it was the previous week.
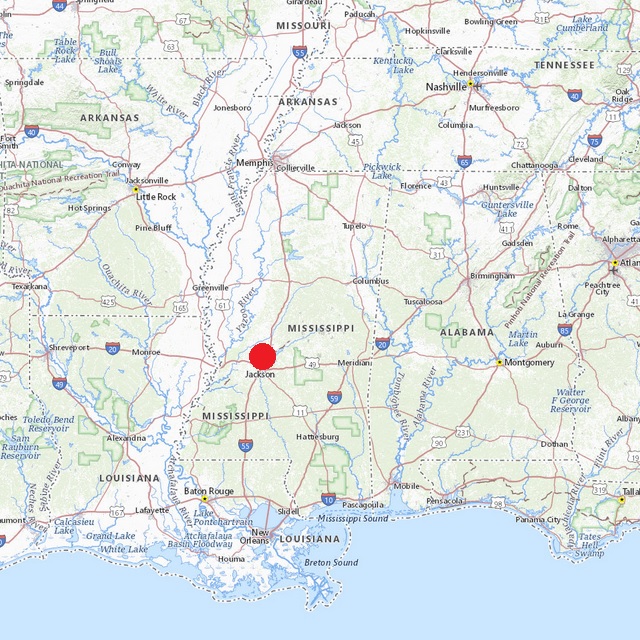
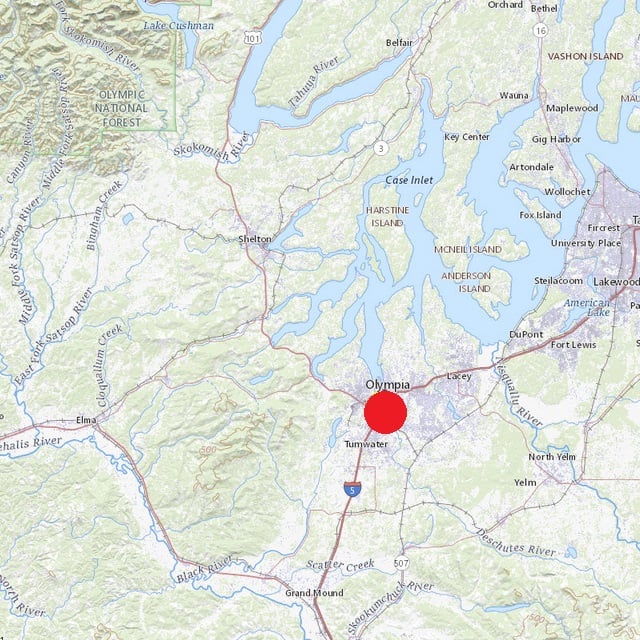
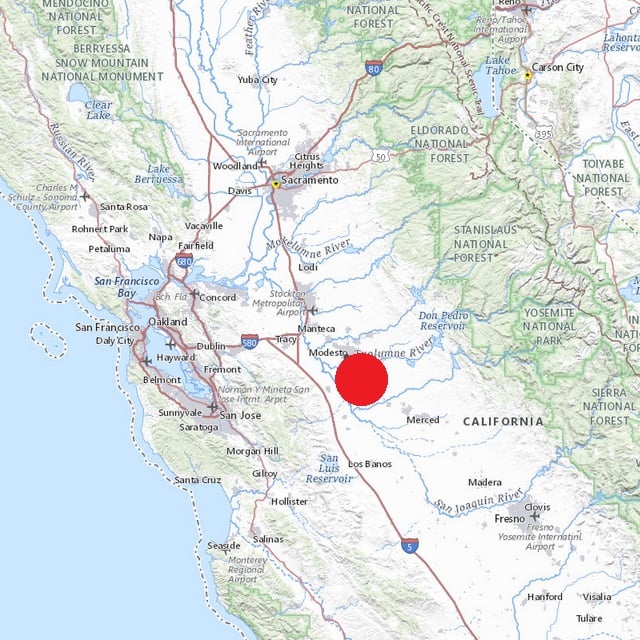
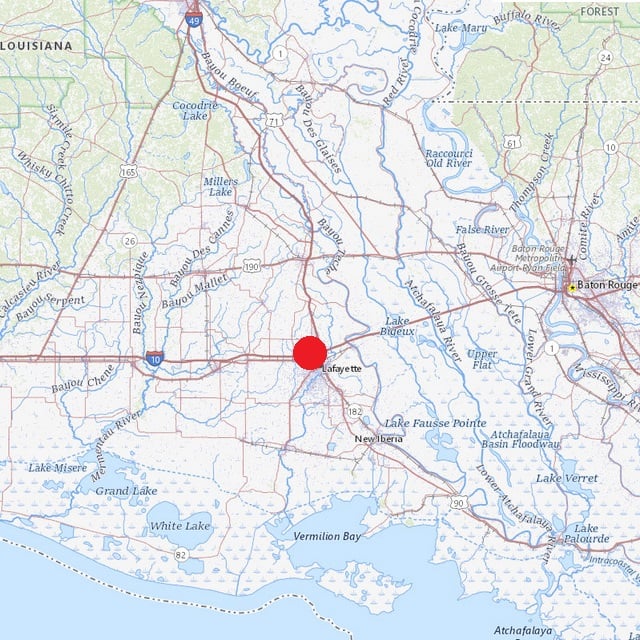
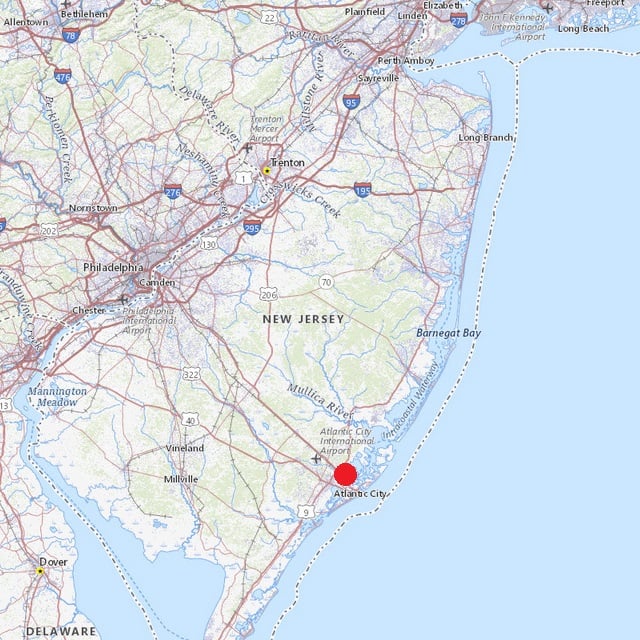
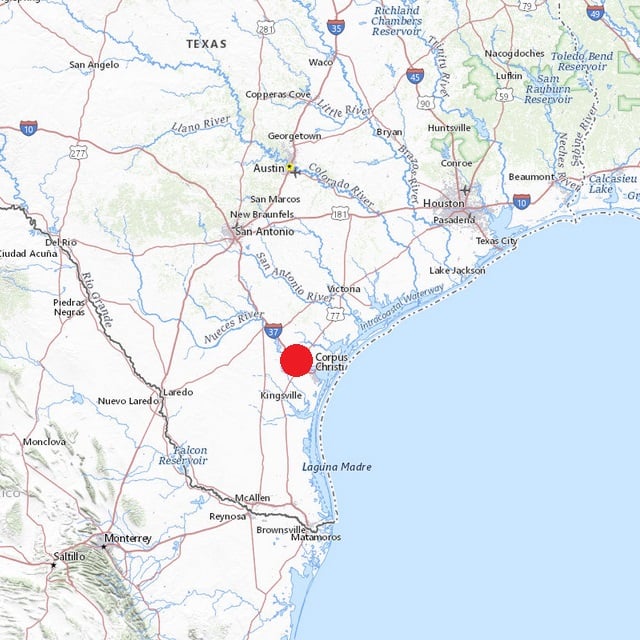
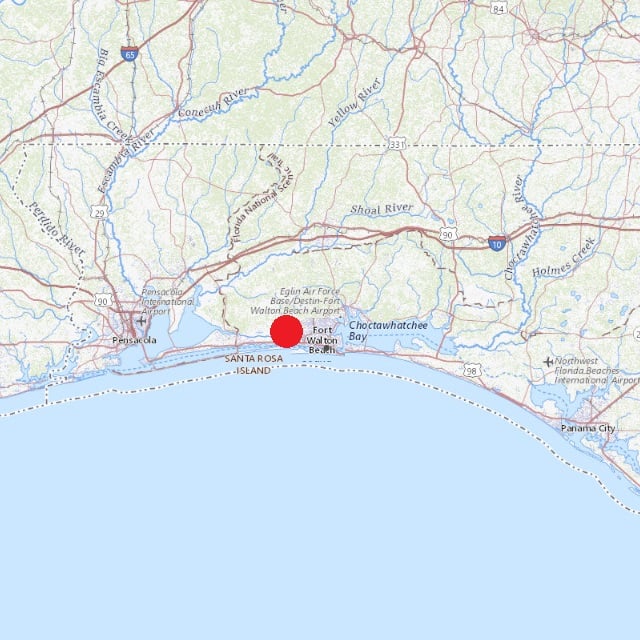
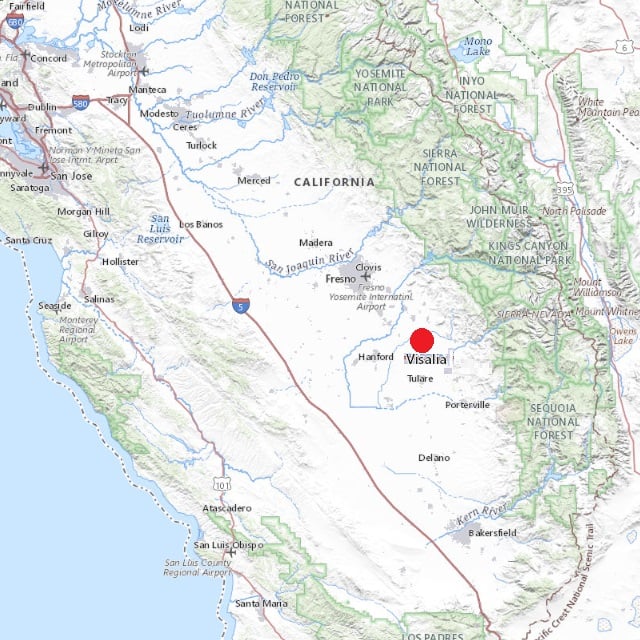
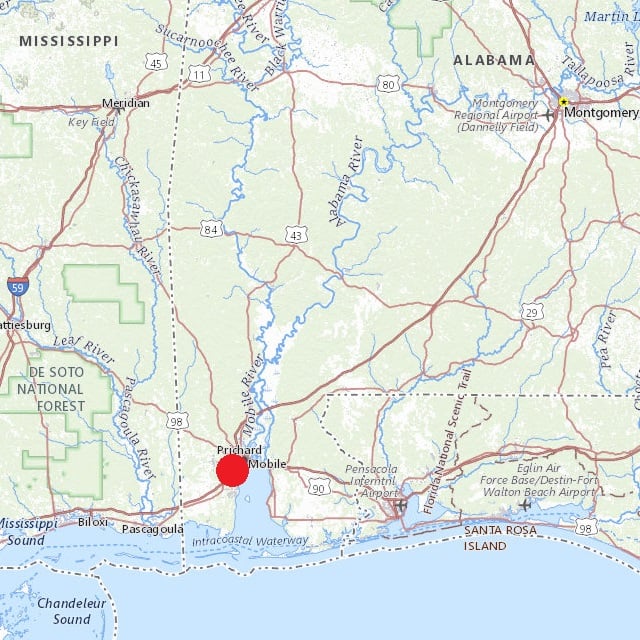
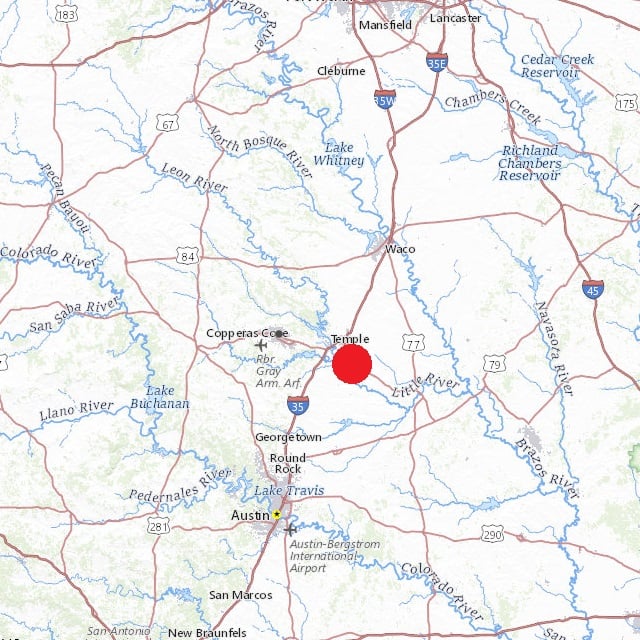
For a list of the communities with significant numbers of COVID-19 cases and the biggest spikes in COVID-19 hospitalization rates, see the gallery above.
What It Means
Life insurers and actuaries are hoping that the COVID-19 pandemic is over, and that it caused only a temporary disruption in the life expectancy data that life insurers, advisors and pension plan sponsors use in estimating how long clients will live.
Any new waves of the pandemic could increase uncertainty about client life expectancy estimates and income planning arrangements.
The Data
HHS COVID-19 trackers included 941 “core-based statistical areas” in their latest Community Profile Report.
To reduce statistical noise, we looked only at the 194 communities with a population of at least 250,000.
Reported hospitalization rates in those 194 communities ranged from 1.2 per 100,000 residents, in the Tuscaloosa, Alabama, area, up to 28.9 per 100,000 residents, in the Gainesville, Florida, area, with a median of about 9 per 100,000 residents.
About 84 of those communities still have COVID-19 hospitalization rates of at least 10 per 100,000 residents.
In 41 of those communities where COVID-19 hospitalizations are still common, the hospitalization rate increased by 10% or more between the seven-day period ending June 14 and the seven-day period ending June 21.
Fewer than one-quarter of large and midsize communities fall into that category, but in those communities, COVID-19 is still putting many people in the hospital and seems to be increasing in intensity.
The increases in hospitalization rates in these communities could be the dying embers of the pandemic, or they could be smoldering sparks that will eventually lead to the creation of dangerous new variant and a new pandemic wave.
Hospitalizations vs. Cases
Hospitalization trends may now be the first sign insurers and advisors have that a bad COVID-19 wave is coming, because people now have ready access to home test kits.
Many people with mild or even moderate cases may simply test themselves at home and recover on their own, without ever telling physicians that they have COVID-19.
(Photo: Andrea Booher/FEMA)


 Slideshow