Close Close
Popular Financial Topics Discover relevant content from across the suite of ALM legal publications From the Industry More content from ThinkAdvisor and select sponsors Investment Advisor Issue Gallery Read digital editions of Investment Advisor Magazine Tax Facts Get clear, current, and reliable answers to pressing tax questions
Luminaries Awards
ThinkAdvisor

Life Health > Health Insurance > Life Insurance Strategies

U.S. Male Obesity Rate Keeps Climbing

X
Your article was successfully shared with the contacts you provided.

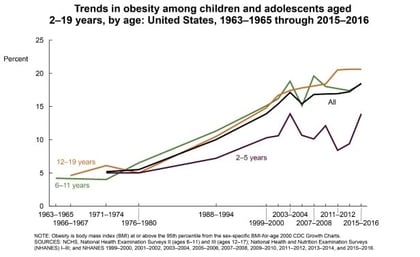
New updates from the U.S. Centers for Disease Control and Prevention (CDC) show that obesity rates are still increasing for adult men, and soaring for children ages 2 to 5.

Analysts at the CDC based the new reports on data from the 2015-2016 wave of  the National Health and Nutrition Examination Survey, or NHANES.

The NHANES team measures the participants’ body mass index (BMI), rather than simply asking over the telephone how much people weigh.

(Related: 10 States Where Stroke May Wreck Your Sales)

Because weight trends have a big effect on people’s health, and life expectancy, the NHANES weight data for adults can give agents and brokers ideas about what might happen in the near future to claims, and rates, for life insurance, disability insurance, long-term care insurance, and other products with claim costs that depend on the insured people’s health.

The NHANES weight data for small children might hint at what product costs could look like in the 2040s.

Here’s what happened the overall percentages of adults ages 20 and older who fit into the three major weight categories included in the new adult weight data update, between the 2013-2014 survey wave and the 2015-2016 wave:

Overweight (BMI from 25 kg/m2 to just under 30 kg/m2): Fell to 31.6%, from 32.5%.

Obese (BMI from 30 kg/m2 to just under 40 kg/m2): Increased to 39.6%, from 37.7%.

Severely obese (BMI of 40 kg/m2 or higher): Held steady at 7.7%.

For both adult men and adult women, the changes in the percentage who were either overweight or severely obese were within the margin of error. That means that, from the standpoint of someone interested in statistics, the male and female overweight rate and severe obesity rate were about the same in both the 2013-2014 and 2015-2016 survey waves.

Similarly, for adult women, the obesity rate hovered around 41% in both survey waves.

For adult men, the obesity rate increased by a substantial amount: to 37.9%, from 35%.

CDC charts show that U.S. adult obesity rates increased gradually between the 1960-1962 wave and the 1976-1980 wave for both men and women; increased rapidly from the 1976-1980 wave to the 2003-2004; and has been moving up and down, but generally upward, since the 2003-2004 wave.

In the update on children, tables show that the percentage of all children ages 2 to 19 who were classified as overweight, obese or severely obese held steady at about 40%.

The percentage of children ages 12 to 19 classified as obese held steady at about 21%.

The percentage of children ages 6 to 11 classified as obese stood at 18.4% in the 2015-2016 survey wave. The change between the 2013-2014 and the 2015-2016 wave was within the margin of error.

The percentage of children ages 2 to 5 classified as obese jumped to 13.9%, from 9.4%. That increase was far larger than the margin of error, which was 1.3% for 2013-2014 and 1.1% for 2015-2016.

For boys ages 2 to 5, the obesity rate increased to 14.3%, from 8.8%.

For girls in that age group, the obesity rate increased to 13.5%, from 10%.

CDC analysts did not discuss the reasons behind the increase in the obesity rate for children ages 2 to 5.

Resources

Copies of the new NHANES updates, and earlier NHANES data summaries, are available here.

— Read Government Looks the Consumers in the Mouthon ThinkAdvisor.

— Connect with ThinkAdvisor Life/Health on LinkedIn and Twitter.


NOT FOR REPRINT

© 2024 ALM Global, LLC, All Rights Reserved. Request academic re-use from www.copyright.com. All other uses, submit a request to [email protected]. For more information visit Asset & Logo Licensing.


NOT FOR REPRINT

© 2024 ALM Global, LLC, All Rights Reserved. Request academic re-use from www.copyright.com. All other uses, submit a request to [email protected]. For more information visit Asset & Logo Licensing.


NOT FOR REPRINT

© 2024 ALM Global, LLC, All Rights Reserved. Request academic re-use from www.copyright.com. All other uses, submit a request to [email protected]. For more information visit Asset & Logo Licensing.


NOT FOR REPRINT

© 2024 ALM Global, LLC, All Rights Reserved. Request academic re-use from www.copyright.com. All other uses, submit a request to [email protected]. For more information visit Asset & Logo Licensing.


NOT FOR REPRINT

© 2024 ALM Global, LLC, All Rights Reserved. Request academic re-use from www.copyright.com. All other uses, submit a request to [email protected]. For more information visit Asset & Logo Licensing.


NOT FOR REPRINT

© 2024 ALM Global, LLC, All Rights Reserved. Request academic re-use from www.copyright.com. All other uses, submit a request to [email protected]. For more information visit Asset & Logo Licensing.