Podcast Center
 Video Center
 Webcasts
 Resource Center
 Events


 By
By  April 07, 2020 at 06:00 PM


(Related: Gary Shilling: 13 Predictions for a Post-Coronavirus World)
Editor’s Note: The turmoil that the COVID-19 pandemic has wrought has hammered nearly every corner of the economy, already pushing the world to the edge of a recession. In May of 2018, ThinkAdvisor contributor Mike Patton did a historical dive into the numbers of what indicators are a good guide to predict a recession. This three-part analysis on recessions is a good guide to use when looking into historically normal economic trends.
——————–
In recent months there has been a great deal of discussion about the next U.S. recession. While there’s very little disagreement about its ultimate arrival, there is considerable difference of opinion on when.
When you add the ability to predict the next recession using the slope of the curve to the conversation, the opinions become as numerous as the decimal points following the mathematical constant Pi. Does the yield curve always invert prior to a recession? Is there a relationship between the slope of the curve and recessions? What causes the curve to invert? The answers are no, maybe, and several things.
In part 1 of this 3-part analysis on recessions, we’ll call it Recessionomics, we will address these questions. We will look at the slope of the yield curve prior to each of the past seven U.S. recessions. Using U.S. Treasury yield data from January 2, 1962, through April 24, 2018, we will take a close look at this issue. You may find the results a bit surprising.
Defining a Recession
What is a recession? One common definition is two calendar quarters with negative real GDP. According to the National Bureau of Economic Research (NBER), the official source for dating the U.S. business cycle, a recession is defined as:
“…. a significant decline in economic activity spread across the economy, lasting more than a few months, normally visible in real GDP, real income, employment, industrial production, and wholesale-retail sales.”
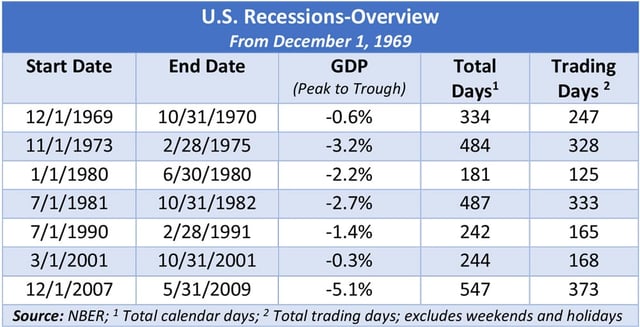
According to the NBER, there have been seven “official” U.S. recessions since 1969. The following table includes a brief overview of each.
- (See gallery above for Table A: U.S. Recessions–Overview)
Table A shows when each recession started and ended, the degree of contraction in economic activity (GDP), the total number of days, and the total number of trading days or dates when the fixed income markets were open. Considering the seven recessions in Table A, the Great Recession of 2008 was the most severe and lasted the longest (547 days/1.5 years). The 1973-74 recession was the second most severe and third in length. Surprisingly, the recession following the Tech Bubble was the mildest.
The Yield Curve
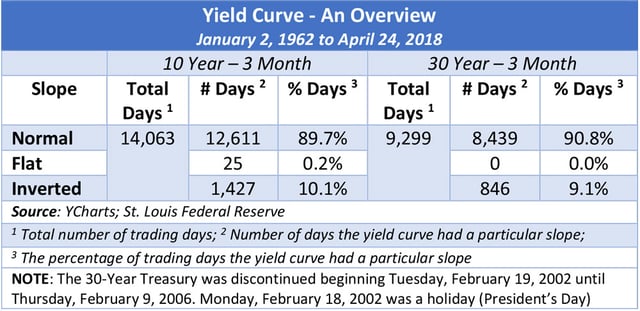
For our analysis, we will use the yield on the 10-year Treasury at the long end of the maturity spectrum for all recessions and add the 30-Year Treasury yield on the five most recent. This is necessary because the 30-Year bellwether wasn’t introduced until February 15, 1977, when it replaced the 25-year bond. At the short end of the curve, we will utilize the yield on the 3-Month Treasury. We will begin the analysis January 2, 1962, the date when data for the 1-, 3-, 5-, and 10-Year Treasuries became available. How often does the yield curve invert? Let’s look at the following, Table B.
- (See gallery above for Table B: Yield Curve–An Overview)
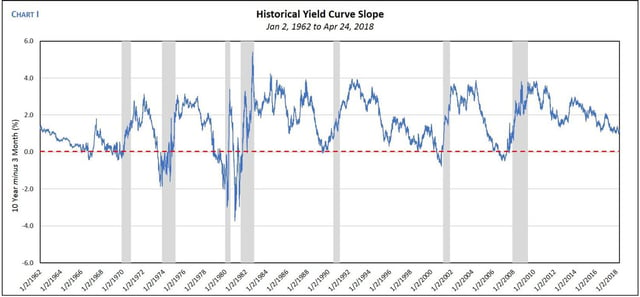
In the period from January 2, 1962, through April 24, 2018, using the yield differential between the 10-Year and the 3-Month Treasury, the yield curve was inverted 1,427 days out of a total 14,063 trading days. Thus, the curve was inverted 10.1% of the time, normal 89.7% of the time, and flat 0.2% during this period. Using the 30-Year Treasury, the results were very similar as the curve was inverted 9.1% of the time and normal 90.8% of the time. The following chart (Chart I) contains the yield differential between the 10-Year Treasury and the 3-Month Treasury, from January 2, 1962 to April 24, 2018. The grey-shaded areas represent periods of recession and the red-dotted line separates a normal curve from an inverted curve. In short, when the line was above (below) zero the curve was normal (inverted).
- (See gallery above for Chart I: Historical Yield Curve Slope)
In addition to the slope of the yield curve, the chart also illustrates the degree of the slope during the entire period. Upon closer examination we find some interesting observations. For example, notice how the yield curve inverted twice prior to the first recession (first vertical grey-shaded area) and then normalized. It’s also interesting, but not necessarily surprising, that the yield curve began to normalize before the end of each recession. Additionally, prior to the fifth recession, which began July 1, 1990, the yield curve flattened considerably, then became increasingly normal prior to, during, and well after it ended. Finally, the yield curve was normal prior to the three most recent recessions. We will discuss all these issues in more detail.
Is an Inverted Yield Curve a Precursor of a Recession?
This has been the million-dollar question. To answer it, we will examine the slope of the yield curve 12-, 6-, 3-, and 1-Month prior to each recession listed in Table A.
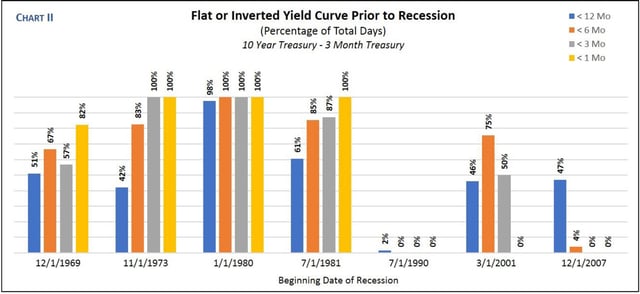
The following chart (Chart II) contains the results of all seven recessions using the 10-Year Treasury. In the 12 months prior to each (excluding the recession beginning July 1,1990), the yield curve was flat or inverted 42% to 61% of the total number of trading days (blue column; see key in upper right of chart). To clarify, there were 249 trading days in the 12-month period prior to the recession which began July 1,1981. The yield curve was flat or inverted 151 days, or 61% of the time. The recession preceding it, which began January 1,1980, had the highest percentage of pre-recession inversion. The curve was flat or inverted 98% of all trading days in the 12-month period preceding it and 100% of the days in the 6-, 3-, and 1-Month periods prior to its inception.
- (See gallery above for Chart II: Flat or Inverted Yield Curve Prior to Recession, 10-Year Treasury)
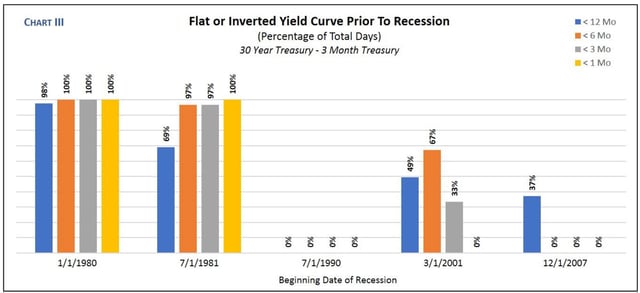
When you substitute the 30-Year for the 10-Year, the results are very similar (see Chart III). As a reminder, the 30-Year Treasury didn’t exist until February 15, 1977, and is excluded from Chart II. Chart III includes the five most recent recessions. We find that leading up to the 1990 recession, there was virtually no inversion in the yield curve. Moreover, in last two recessions, there is an interesting trend. In Charts II and III, we find the yield curve was inverted 12-months prior, but 30 days before each recession began, the slope was normal. This trend was more drastic prior to the Great Recession of 2008. It seems the yield curve has been a less reliable predictor of recession since the late 1980s. Why? Let’s examine this now.
- (See gallery above for Chart III: Flat or Inverted Yield Curve Prior to Recession, 30-Year Treasury)
What Factors Influence Short- and Long-Term Interest Rates?
Since the slope of the yield curve is determined by the difference in short- and long-term interest rates, we must consider the factors that influence each. Thus, we’ll explore the policies of the Federal Reserve in relation to the health of the U.S. economy. When the economy begins expanding too rapidly, creating inflationary fears, the FOMC will, among other things, raise the target fed funds rate, which is a short-term rate. When the U.S. economy slows, interest rates at the long end of the spectrum tend to decline. This is due, at least in part, to investor fear. Fearing a recession and seeking safety, investors will often sell stocks (plus other risky assets) and invest in U.S. treasuries, including those with longer maturities. This increases the demand for these securities, which causes their price to rise and yield to fall. If investors are correct, they will profit from the yield on the bonds as well as the higher price.
When discussing the slope of the yield curve, there are two key issues to consider. First, if the Fed is correct, not only in its timing to raise or lower rates, but in the degree of change, the curve is more likely to remain normal. Second, if the perception is that the economy is doing well, but not too well, long-term rates are more likely to remain above short-term rates. However, if the Fed raises rates too much for too long and the perception (or reality) is that U.S. real GDP is, or soon will decline, short-term rates can rise above long-term rates, resulting in an inverted yield curve. It should be noted, although the Fed plays a vital role in this (especially with short-term rates), there are additional factors that influence interest rates.
Why hasn’t the yield curve inverted prior to recessions in recent decades like it did before 1990? I believe technology is a key reason. With the advent of the computer age, the Fed can obtain more accurate data, more quickly than it could in the past. Better information should result in a more accurate assessment of the economy and yield better decisions.
Which Type of Curve Is Best?
Given the choice between an inverted, flat, or normal sloping yield curve, the latter is preferable. Why? It is an indicator of a healthy economy. In addition, banks profit more when the curve is normal and since most, if not all, of the money in the economy flows through these institutions, it’s difficult to have a strong and vibrant economy when banks are struggling. This is because banks borrow money from the Fed at short-term rates and loan money based on longer term rates. Therefore, if their cost of borrowing is low and the economy is strong – increasing demand for loans – the interest rate spread is wider, resulting in a greater profit.
Summary
The slope of the yield curve is based on the difference between short- and long-term interest rates. Short-term rates depend on the Fed’s ability to make good decisions and long-term rates are a reflection of the health of the economy plus other issues. With the advance of technology, the Fed has demonstrated an improved ability to manage the interest rate lever well.
Is it possible the yield curve will rarely invert in the future? Do we need to find a better recession predictor? The yield curve as a recession predictor may be part of a bygone era, but one thing seems certain, the business cycle is not going to disappear. I believe the Fed is better equipped to manage monetary policy. Now if we can only get our fiscal house in order!


 Slideshow